ERA Country Report 2023
Greece
Edited by Christina Kakderi (Independent Science, Technology and Innovation policy expert)
as part of ‘Development of the ERA Scoreboard, the ERA Dashboard and the Regular Reports’ project for the European Commission, Directorate-General for Research and Innovation under Framework Contract N° 2018/RTD/A2/OP/PP-07001-2018 Lot 2 (EDAR)
Click here to download this country report![]()
- Table of contents
-
ERA Country Report 2023: Greece
1. National context
1.1. Overview of the ERA policy agenda implementation
1.2. Policy context
2. Assessment of the Implementation of the ERA Policy Agenda and ERA Priorities
2.1. ERA Priority 1: Deepening a truly functional internal market for knowledge
2.2. ERA Priority 2: Taking up together the challenges posed by the twin green and digital transition and increasing society’s participation in the ERA
2.3. ERA Priority 3: Amplifying access to research and innovation excellence across the Union
2.4. ERA Priority 4: Advancing concerted research and innovation investments and reforms
3. Country-specific drivers and barriers
4. Final remarks
5. Bibliography
6. Annexes
6.1. Annex 1: Graphs
ERA Country Report 2023: Greece
|
Key takeaways:
|
1. National context
1.1. Overview of the ERA policy agenda implementation
Greece is a Moderate Innovator according to the European Innovation Scoreboard (EIS) with a performance at 79.5% of the EU average in 2023. ^ The European Semester Report for Greece of 2023 indicates that the country is one of the Member States that has significantly improved its overall performance between 2015 and 2021. Greece exhibits cross-regional disparities in innovation performance, digital integration and skills. There is also a notable regional concentration of research activities. While the design and implementation of research and innovation policies at the national level is deemed to contribute to this point, cohesion policy is expected to play a counterbalancing role. ^
Greece has committed to six ERA Actions, covering the first two ERA priority areas: “Deepening a truly functioning internal market for knowledge” and “Taking up together the challenges posed by the Twin Green and Digital Transition, and increasing society’s participation in the ERA”.
The National Strategy for Research, Technological Development, and Innovation (NSRTDI – ESETAK 2021-2027) is the main strategy underpinning the implementation of the European Research Area (ERA). Under this strategy, priority axes “Excellence and human capital” and “Social challenges/interconnection of science and society” are specially aligned to the priorities of the ERA. ^
Among all ERA priorities, Greece is particularly committed towards the development of long-term investments in large-scale research infrastructures to support the R&I ecosystem mainly through the update of the Multiannual Budgeting Plan (MBP) for Research Infrastructures and the National Roadmap for Research Infrastructures for 2021-2027. ^ In this context, Greece is particularly supportive of the New European Innovation Agenda and the creation of synergies between Horizon Europe and the Structural Funds. ^
1.2. Policy context
In Greece, the development and implementation of Research, Technological Development and Innovation (RTDI) policies is concentrated at the national level with the main responsible authority being the General Secretariat for Research and Innovation (GSRI) supported by the National Council for Research, Technology and Innovation (NCRTI). GSRI, which supervises Greece’s public research centres, functions under the umbrella of the Ministry of Development, while the Ministry of Education, Religious Affairs and Sports (MERAS) is overseeing universities. In 2016, the Hellenic Foundation for Research and Innovation was created to support research and innovation activities on the basis of excellence.
GSRI is the main authority to formulate the design and implementation of the National Strategy for Research, Technological Development, and Innovation. ^ The strategy includes the National Strategy for Smart Specialisation and the Strategy for Basic Research. It is also aligned with other national strategies and initiatives such as Greece’s Recovery and Resilience Plan “Greece 2.0”, the regional development strategies, the Digital Transformation Strategy for 2020-2025 and the National Energy and Climate Plan (NECP). Additionally, the NSRTDI has an emphasis on internationalisation of the research and productive ecosystem ^ which corresponds to the third ERA priority.
Finally, Greece’s Recovery and Resilience Plan (RRP) and the implementation of cohesion policy in Greece undertakes supporting actions to the R&I system, such as the increase of R&I expenditures, the reverse of the “brain drain”, the improvement of innovation uptake from businesses and the support of knowledge and technology transfer.
2. Assessment of the Implementation of the ERA Policy Agenda and ERA Priorities
Chapter 2 has two objectives: 1) It qualitatively assesses the state-of-play of the implementation of the ERA Actions that Greece has committed to. The qualitative information primarily stems from the OECD STIP survey 2023, supplemented by further desk research; 2) It quantitatively assesses the country’s progress towards achieving the ERA priorities as set out on the Pact for Research and Innovation in Europe.
The presented quantitative information is mainly based on the ERA Scoreboard and ERA Dashboard indicators, and covers longer-term trends since 2010. Additionally, general indicators for the overall R&I system are outlined in Table 1. More detailed information on the data and graphs can be found in Annex 1. This report will serve as a baseline for reporting in the future.
|
Indicator |
Most recent EU average |
Most Recent Metric |
|
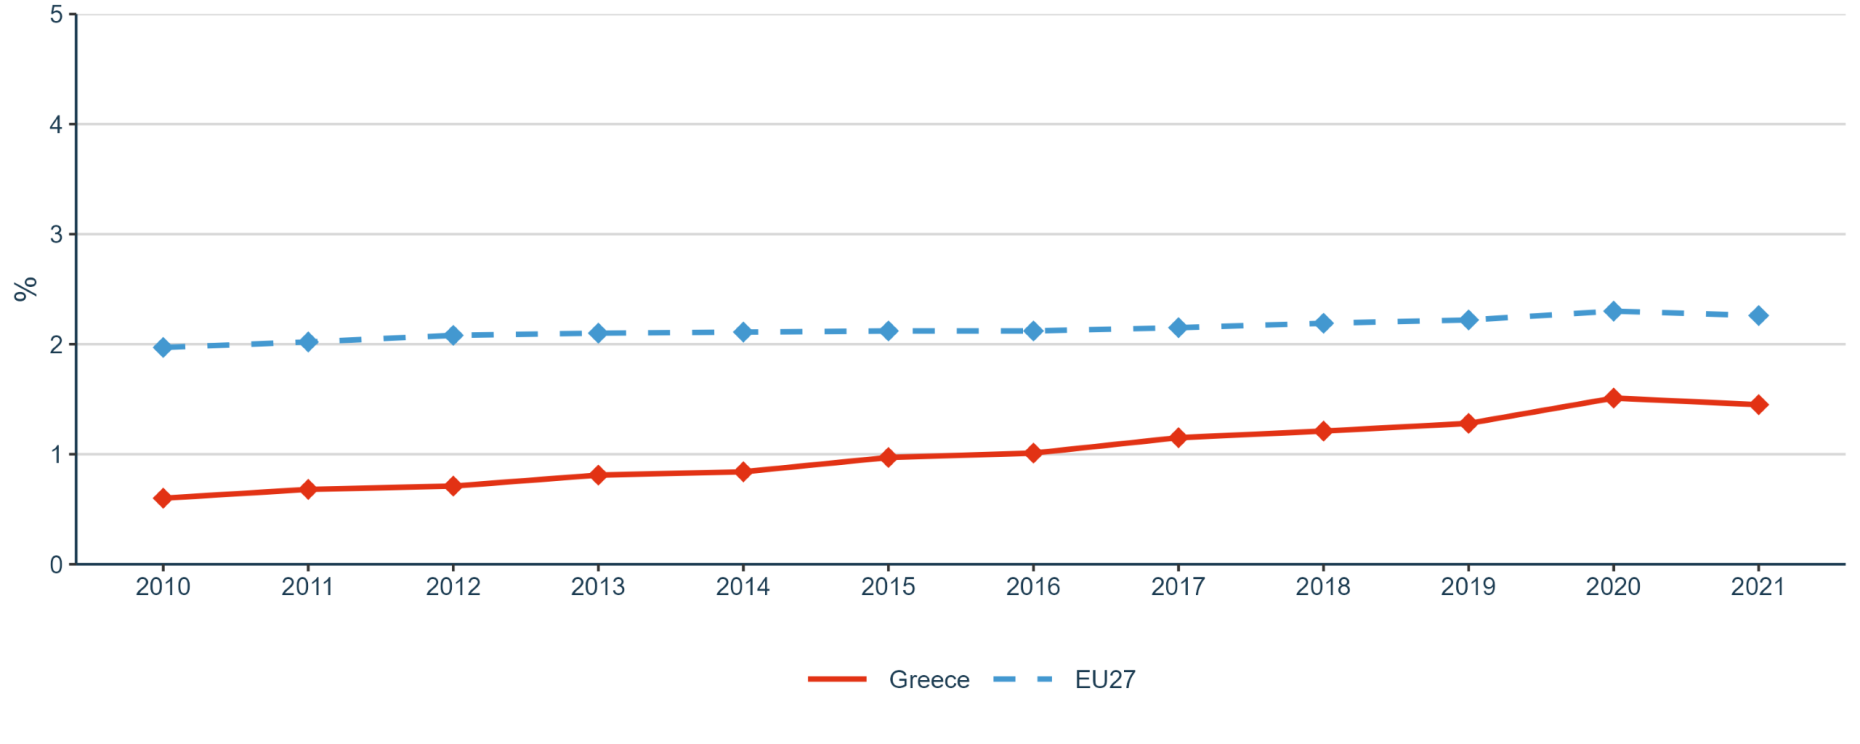
Gross Domestic Expenditure on R&D (GERD) as a percentage of GDP |
2.26 (2021) |
1.45 (2021) |
|
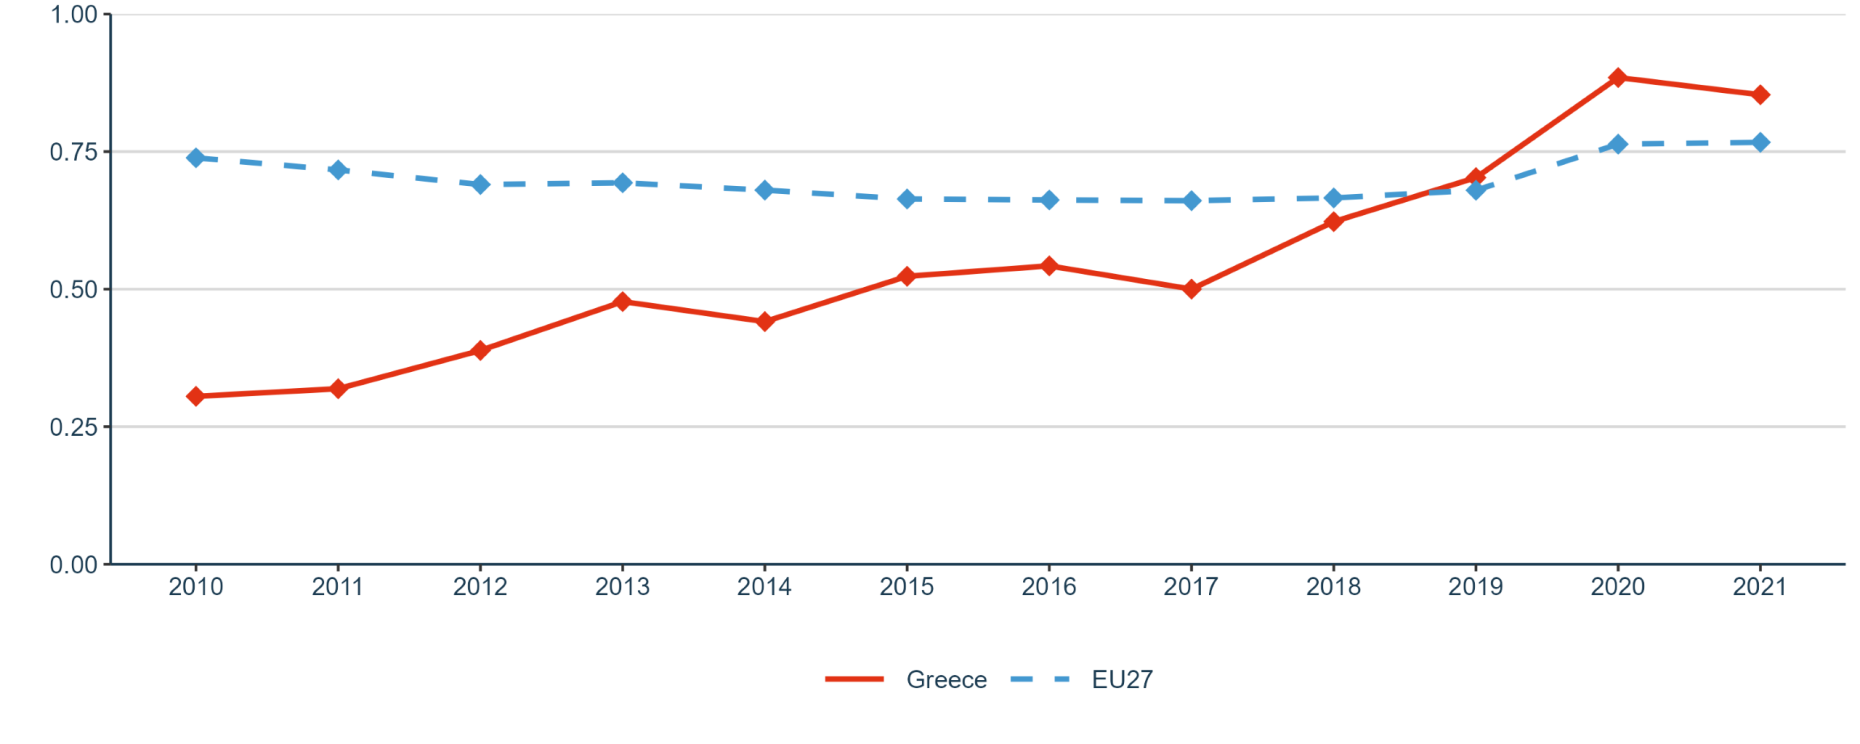
Government Budget Allocations for R&D (GBARD) as a share of GDP |
0.76 (2021) |
0.85 (2021) |
|
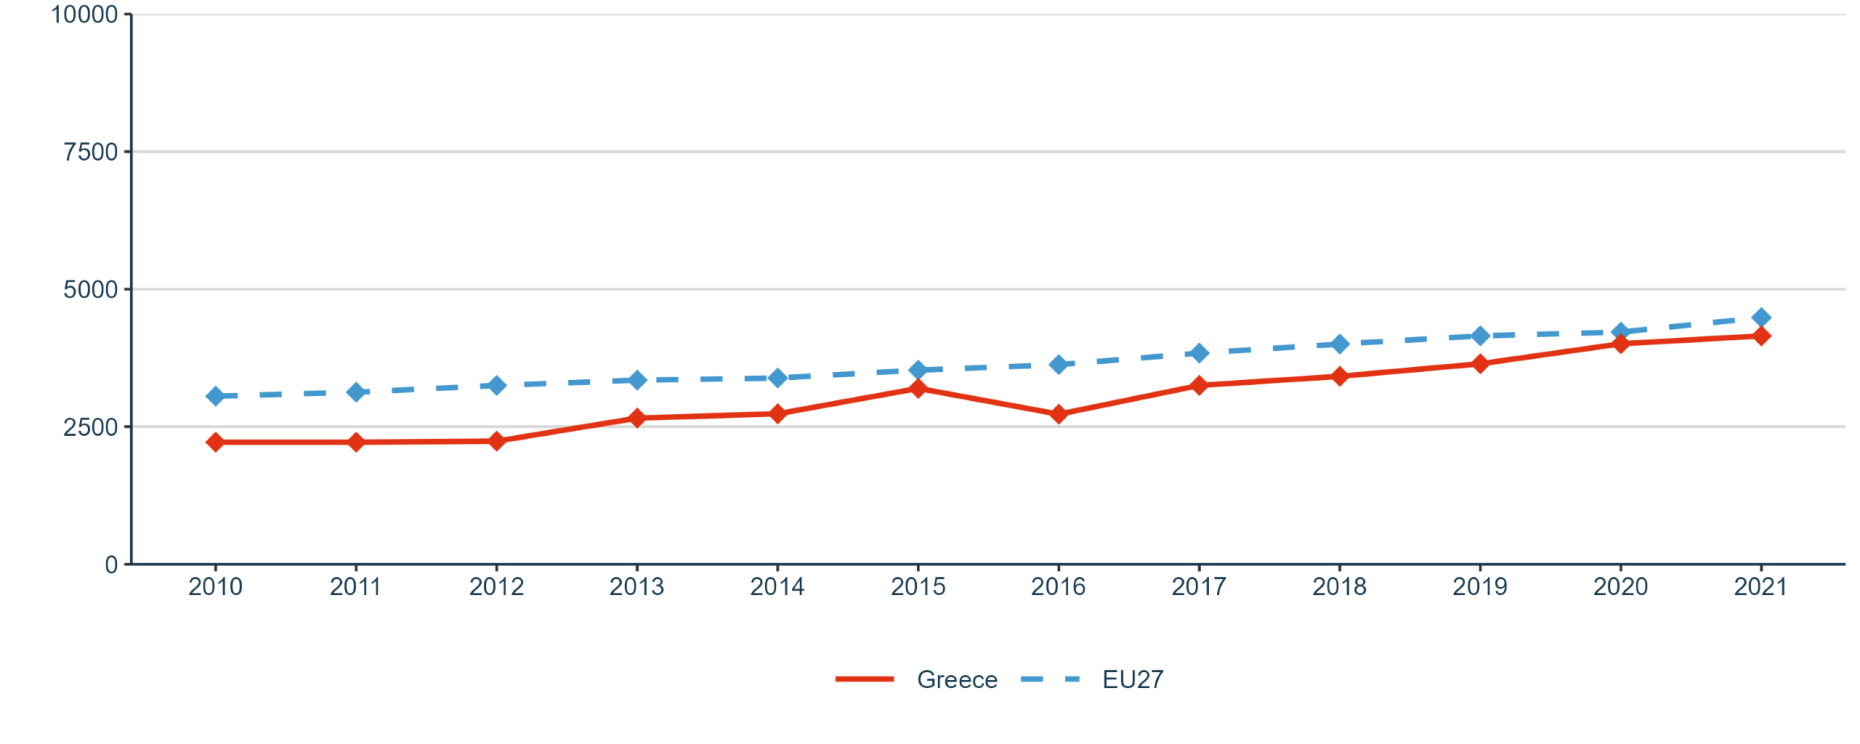
Researchers (in full-time equivalent) per million inhabitants |
4,483.4 (2021) |
4,150.1 (2021) |
|
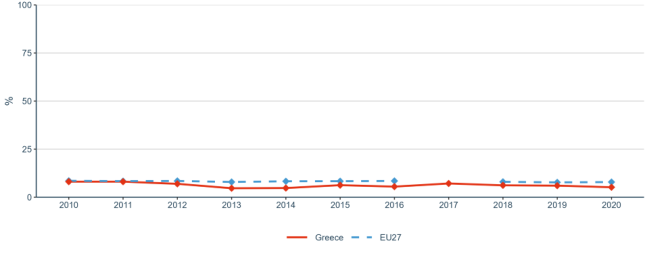
Business Enterprise expenditure on R&D (BERD) as a percentage of GDP |
1.49 (2021) |
0.7 (2021) |
Source: compiled by research team based on the ERA Scoreboard and ERA Dashboard indicators
2.1. ERA Priority 1: Deepening a truly functional internal market for knowledge
2.1.1. State of play in the implementation of the ERA Actions
In relation to ERA Action 1: Enable the open sharing of knowledge and the re-use of research outputs, including through the development of the European Open Science Cloud (EOSC), Greece has not yet implemented a National Open Access/Open Science policy. ^ However, a National Open Science Plan has been developed as a bottom-up initiative supported by the Greek Open Science Task Force which aims to become a reference point for the establishment of a National Open Science Strategy in Greece and a role model for the adoption Open Science principles.
A draft plan for Open Science, under consideration by the authorities (the Ministry of Digital Governance, MERAS, GSRI), forms a comprehensive foundation for a National Open Science Strategy. Encompassing key areas such as open access, research data, software development, and e-infrastructures, the plan outlines 62 actions, including infrastructure development, education policies, funding, and legislative measures. In addition, the Hellenic Open Science Initiative, established to formulate and implement the national strategy, involves researchers and library organisations as well as technology providers. ^
Open science principles are also included in other strategic documents such as the Digital Transformation Strategy and the National Strategy for Research, Technological Development, and Innovation (NSRTDI – ESETAK) and are implemented through initiatives such as HEAL-Link, HARDMIN or HELIX which have been identified by EOSC as key best practices. ^
In relation to the ERA Action 4: Promote attractive research careers, talent circulation and mobility, Greece participates in European activities that contribute to this action such as the EURAXESS service, operated by the Centre for Research and Technology Hellas (CERTH), the programme RESAVER etc. Also, the establishment of the Hellenic Foundation for Research and Innovation (HFRI) provides doctoral and post-doctoral fellowships and grants aiming at reversing the brain drain which poses a significant threat to the Greek R&I system. As part of the National Recovery and Resilience Plan, Greece also funds industrial PhD programmes in collaboration with private sector companies.
Further efforts to strengthen skills and talent circulation are pursued through both policy initiatives and private action. The 2021-2027 EPANEK programme emphasizes actions that aim at upskilling and reskilling human resources to meet the needs of industry, particularly in the technology sector. On top of these policies and initiatives, there is also an emerging interest on behalf of large multinationals and foreign high-tech companies to absorb Greek scholars by establishing European Digital Innovation hubs in Greece.
In relation to the ERA Action 8: Strengthen sustainability, accessibility and resilience of research infrastructures in the ERA, the National Roadmap for Research Infrastructures for the 2021-2027 is the main initiative currently in place. It builds on the previous programme, ^ the Operational Programme on Competitiveness, Entrepreneurship and Innovation (EPAnEK). ^ It developed 28 National Research Infrastructures (NRIs) involving 212 organisations across 11 regions through the allocation of EUR 93 million on them. The NRIs aim to create an attractive environment for highly skilled scientific, technical and administrative workers, while making easier for Greek research teams to access global research infrastructures. The new programme is expected to give emphasis to their long-term sustainability, by improving the accessibility of their infrastructure, equipment, and research data, and enhancing the quality and effectiveness of their services to diverse user groups.
2.1.2. Progress towards achieving ERA Priorities
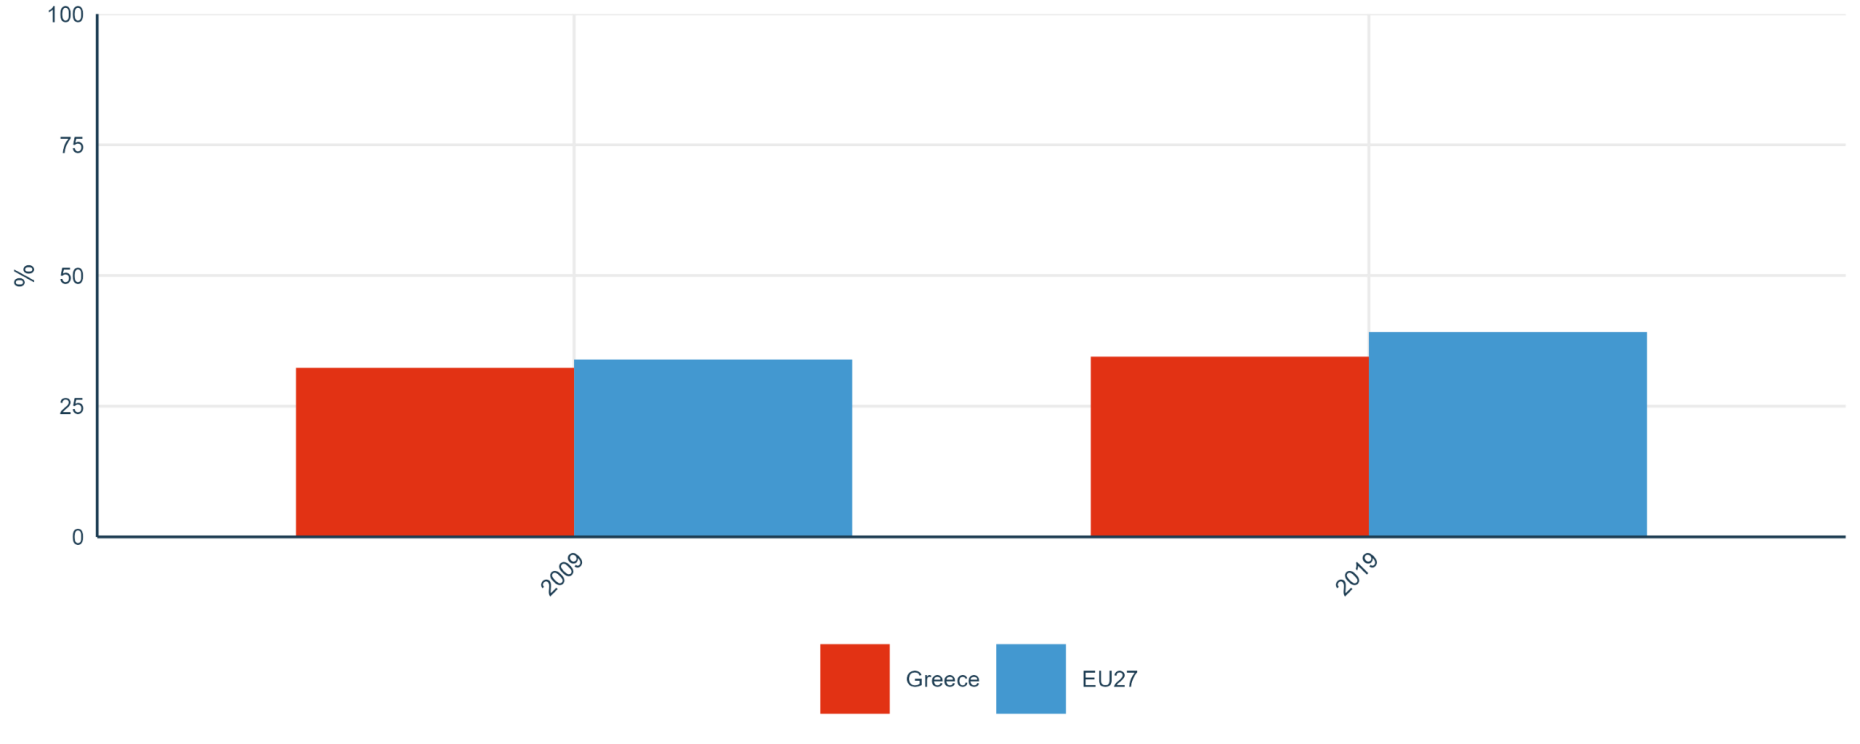
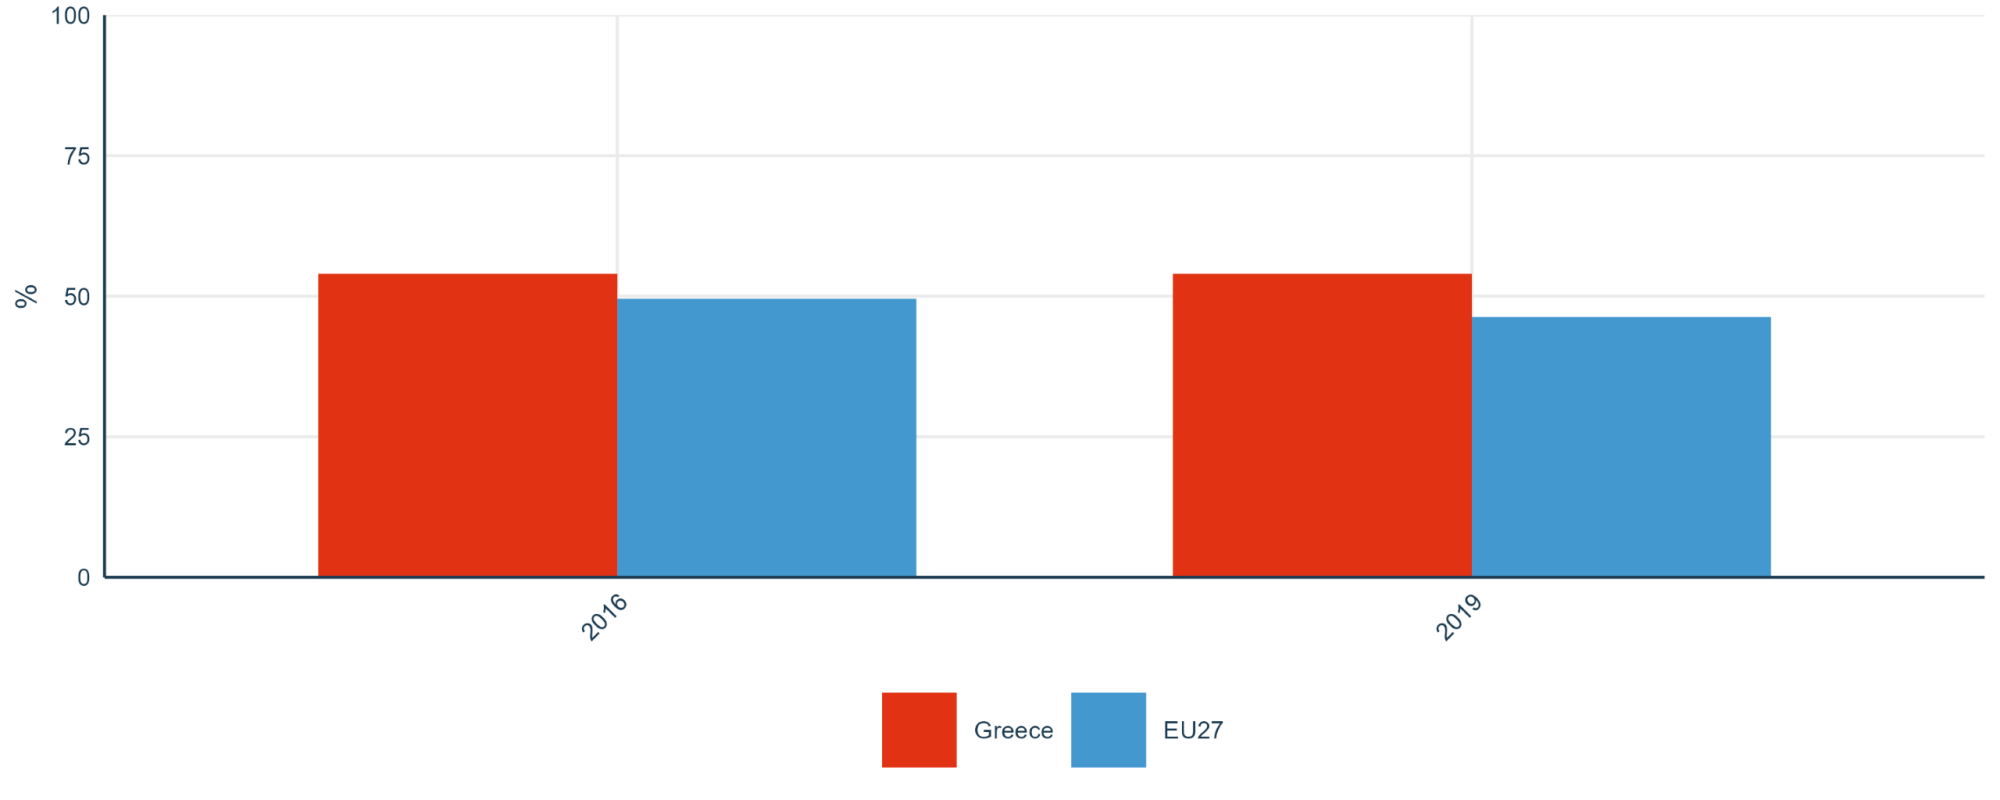
With regard to Sub-priority 1.1: Open science, the share of publications available in open access publications (with DOI) as a proportion of the total number of DOI-publications in Greece has remained lower than the EU average. In 2009, the percentage corresponding to Greek publications was 32.36% against the 33.94% result of the EU-27. Although there is a positive change in 2019, when Greece reached a rate of 34.47%, the improvement is lower than the EU average (39.17%) as illustrated by Figure 5 in Annex 1.
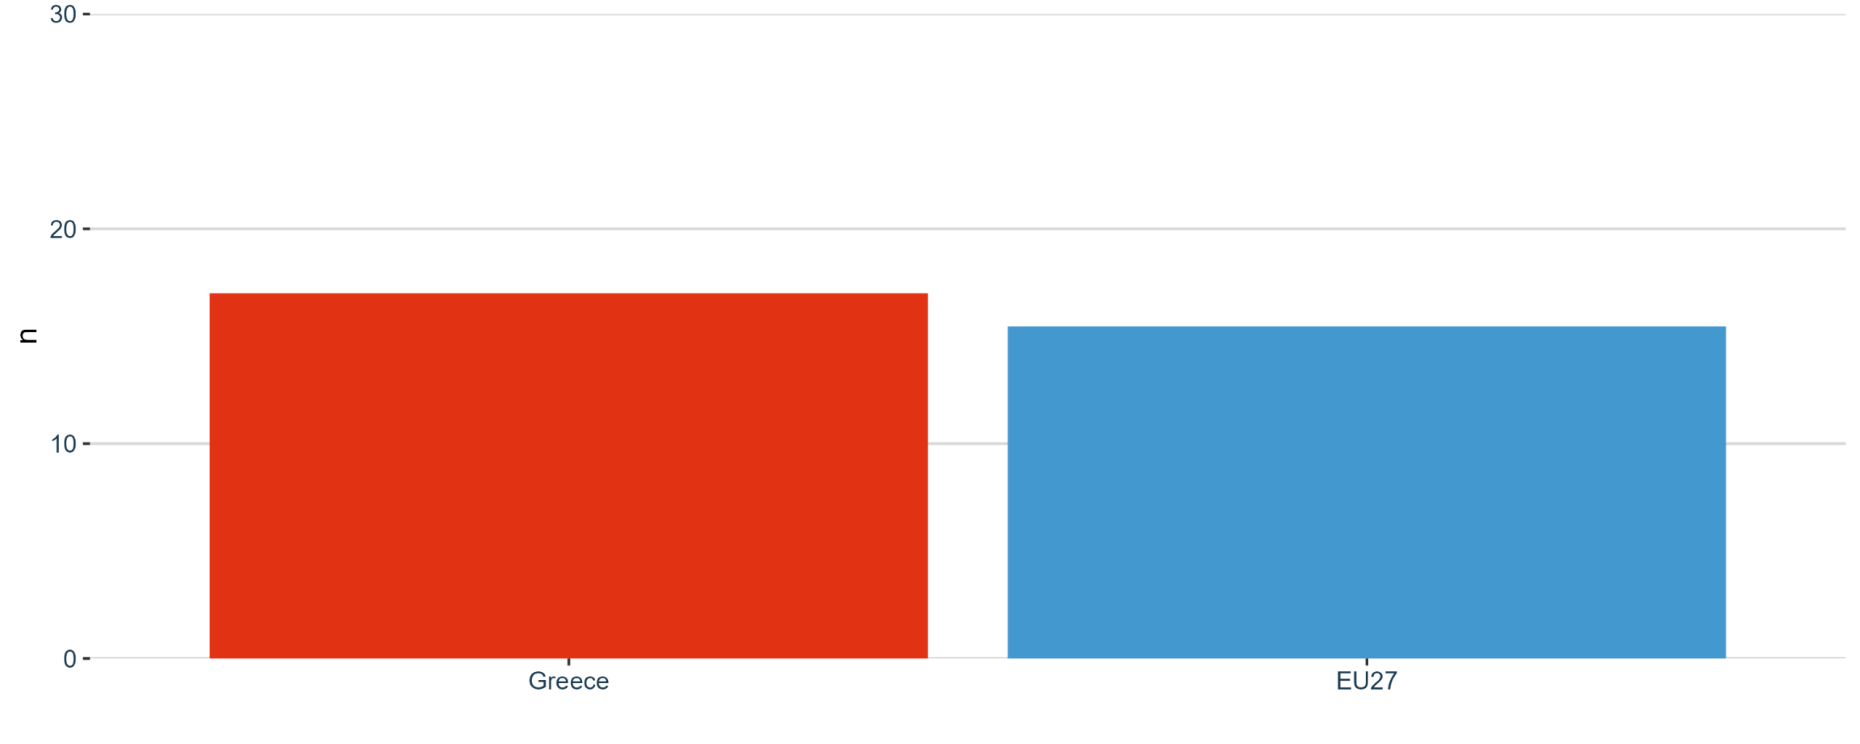
Measuring progress towards Sub-priority 1.2: Research Infrastructure, the country presented a 0.96% on the share of national public R&D expenditure allocated to European research infrastructures in 2022. Hence, Greece performed below the EU average of 1.82% ^ in the same year. In addition, the indicator number of European research infrastructures in which a Member State or an Associated Country participated (financially contributes to operations) in 2021 (Figure 6 in Annex 1) shows that the Greek value is higher than the European average.
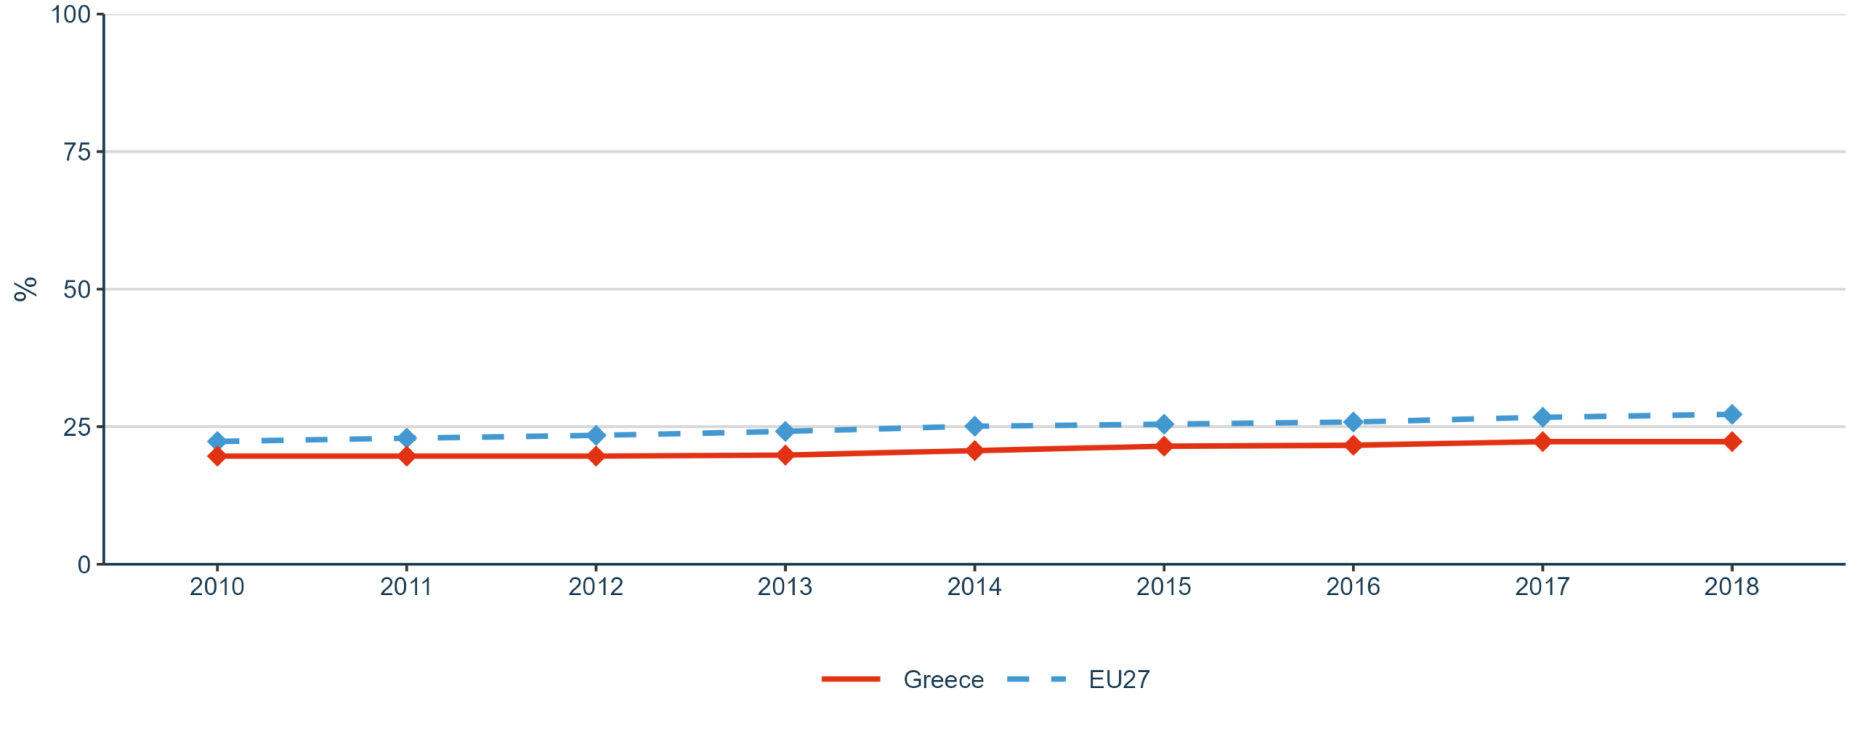
Sub-priority 1.3: Gender equality, equal opportunities for all and inclusiveness. Figure 7 in Annex 1 shows the share of women in grade A positions in HEIs from 2010 to 2018, in which both Greece and the EU-27 follow a similar trend, with Greece maintaining a value slightly below the EU. In terms of the proportion of women among doctoral graduates in STEM, in 2013 the Greek value was below the EU-27 average. However, the country presents a positive trend and increases until 2020 presenting a higher value than the EU-27 average (Figure 8 in Annex 1).
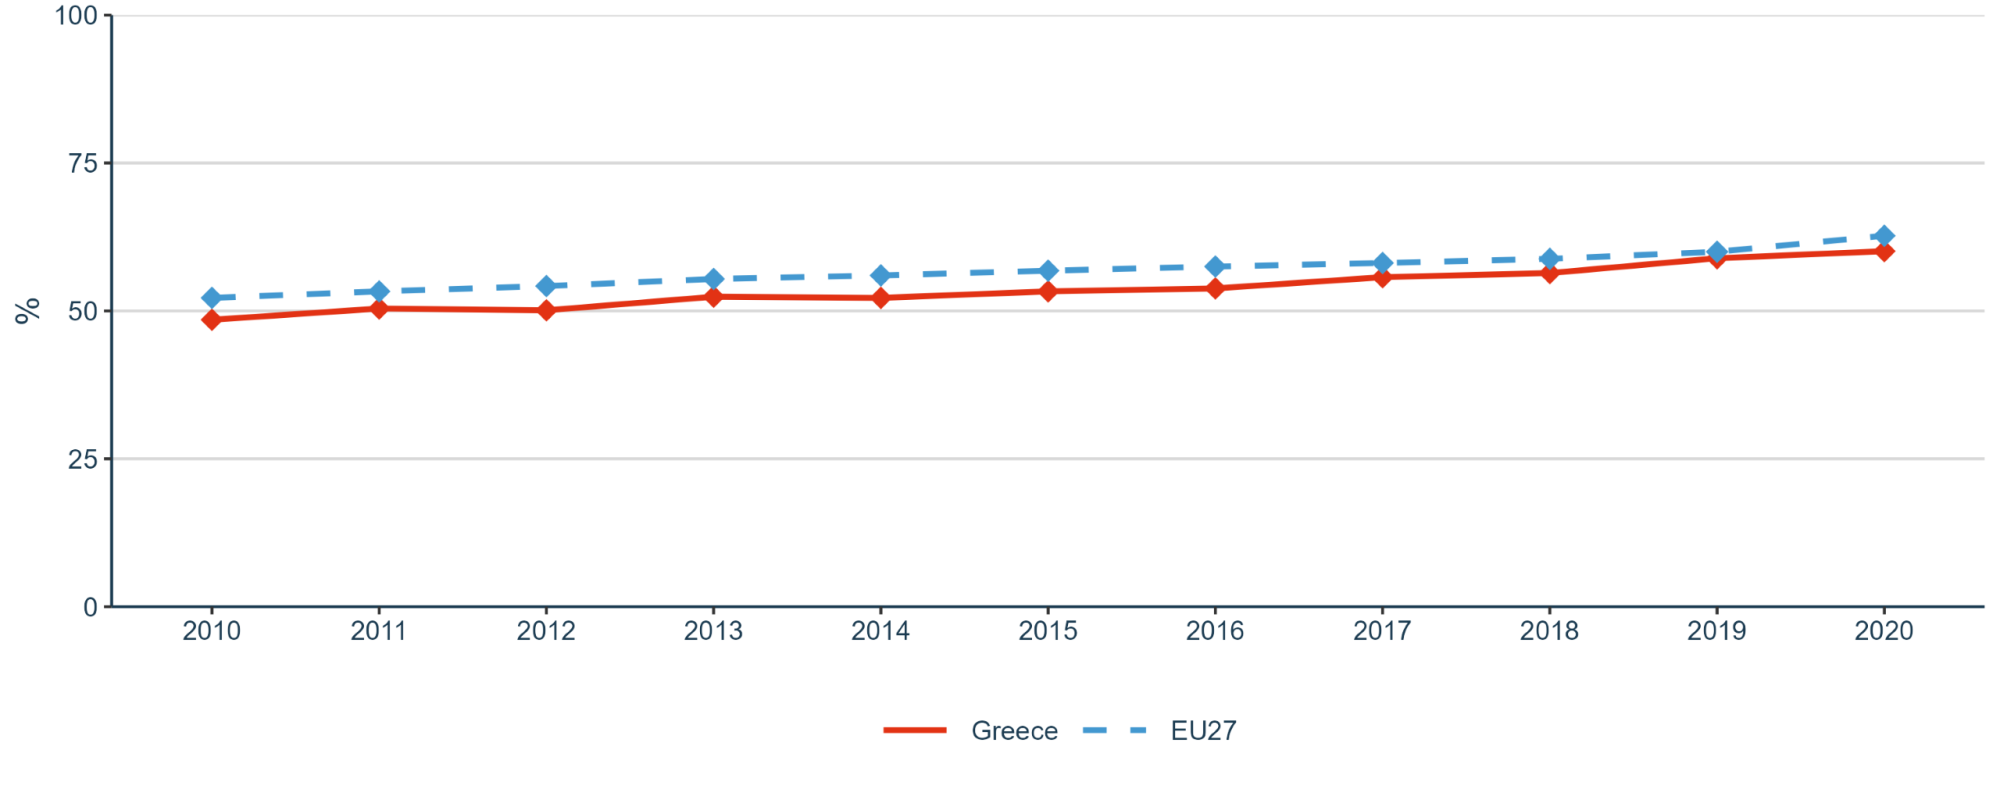
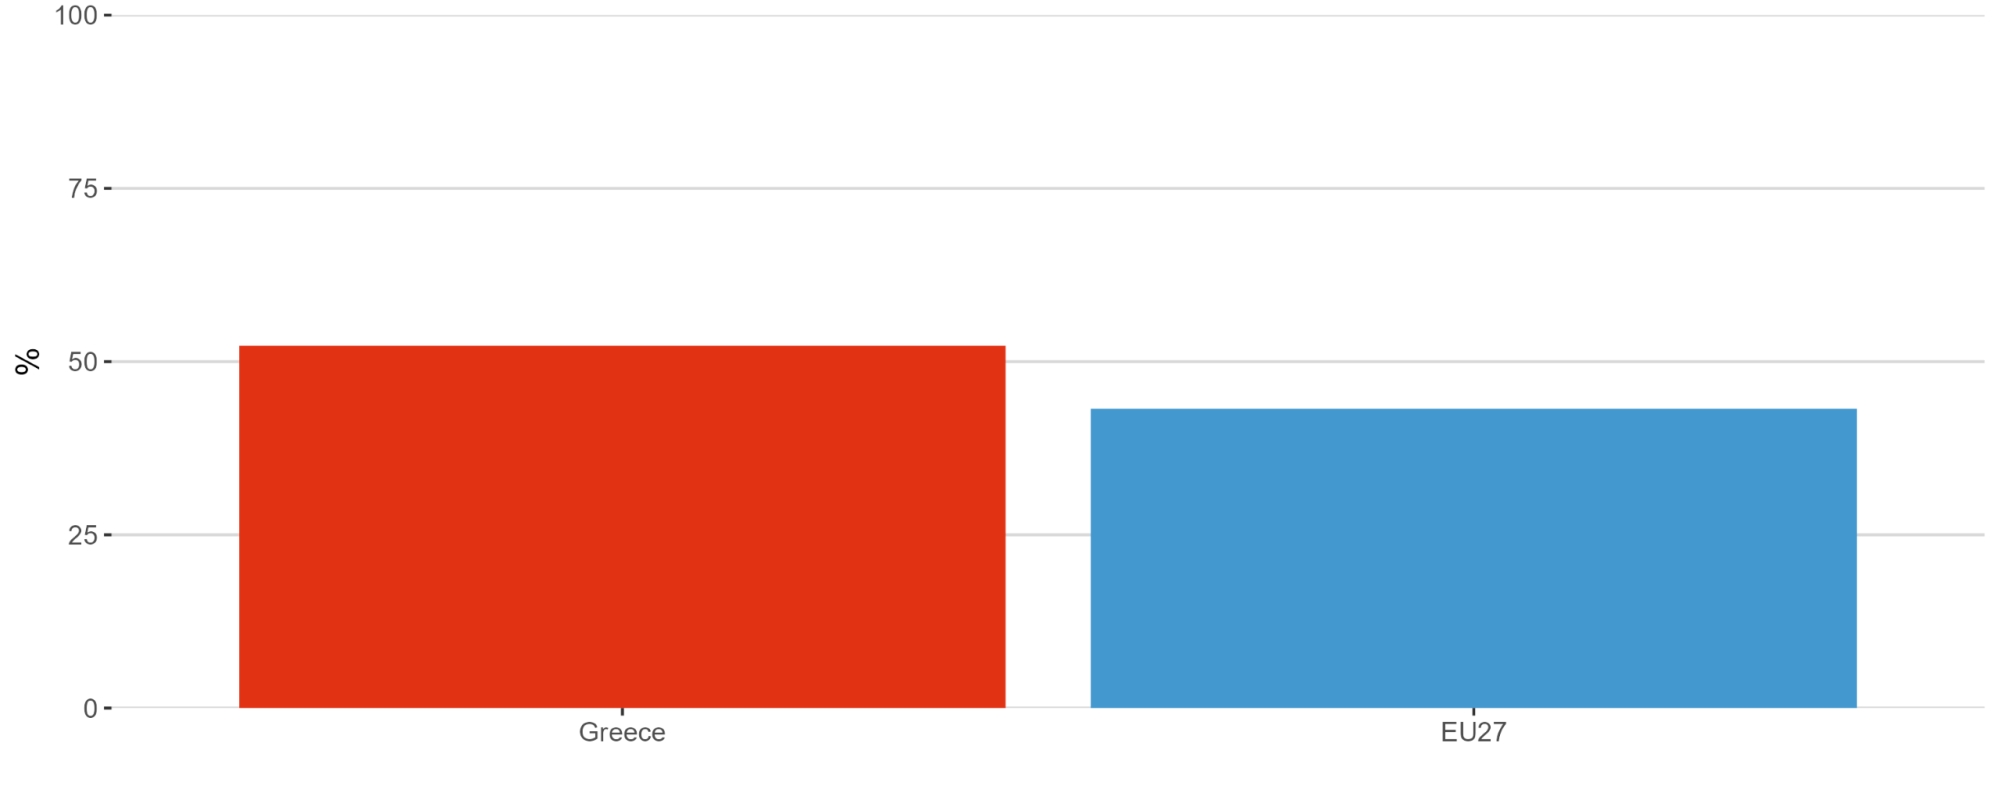
The progress in the proportion of papers with mixed gender authorship from 2010 to 2020 (Figure 9 in Annex 1) is quite similar in both in Greece and the EU in general. Although the Greek value remains under the EU average during the whole period, the gap is gradually decreasing. On the other hand, the Greek proportion of women in authorships in the 10% most cited publications has been decreasing against the positive trend of the European average (Figure 10 in Annex 1). Finally, the Woman Digital Index is represented in Figure 11 of Annex 1. The Greek value is around the 50% but is surpassed by the EU-27 average.
Sub-priority 1.4: Careers and mobility of researchers and research assessment and reward system. In Greece, both the share of foreign doctorate students as a percentage of all doctoral students and the new doctorate graduates per 1000 inhabitants aged 25-34 in Greece are well below the EU average (Figures 12 and 13 in Annex 1). The indicator job-to-job mobility of Human Resources in Science and Technology (HRST) (Figure 14 in Annex 1) follows the same trend.
For almost all indicators both the absolute numbers and the trends between Greece and the EU average are similar, except for the share of foreign doctorate students as a percentage of all doctorate students which seems to widen after 2019.
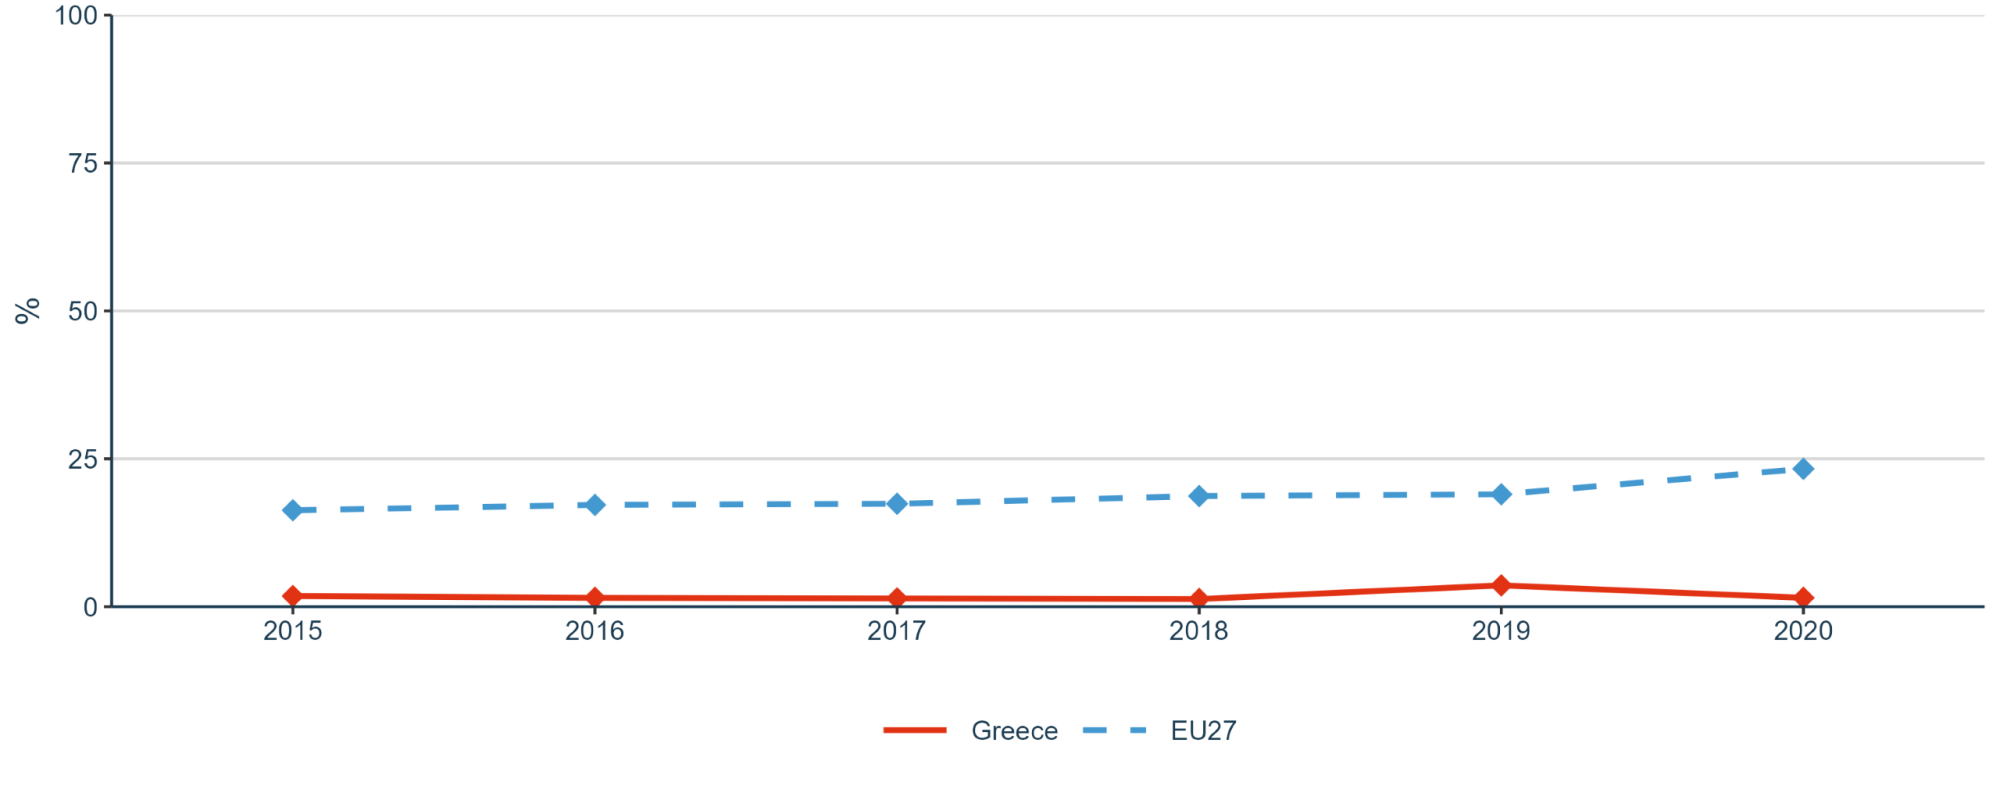
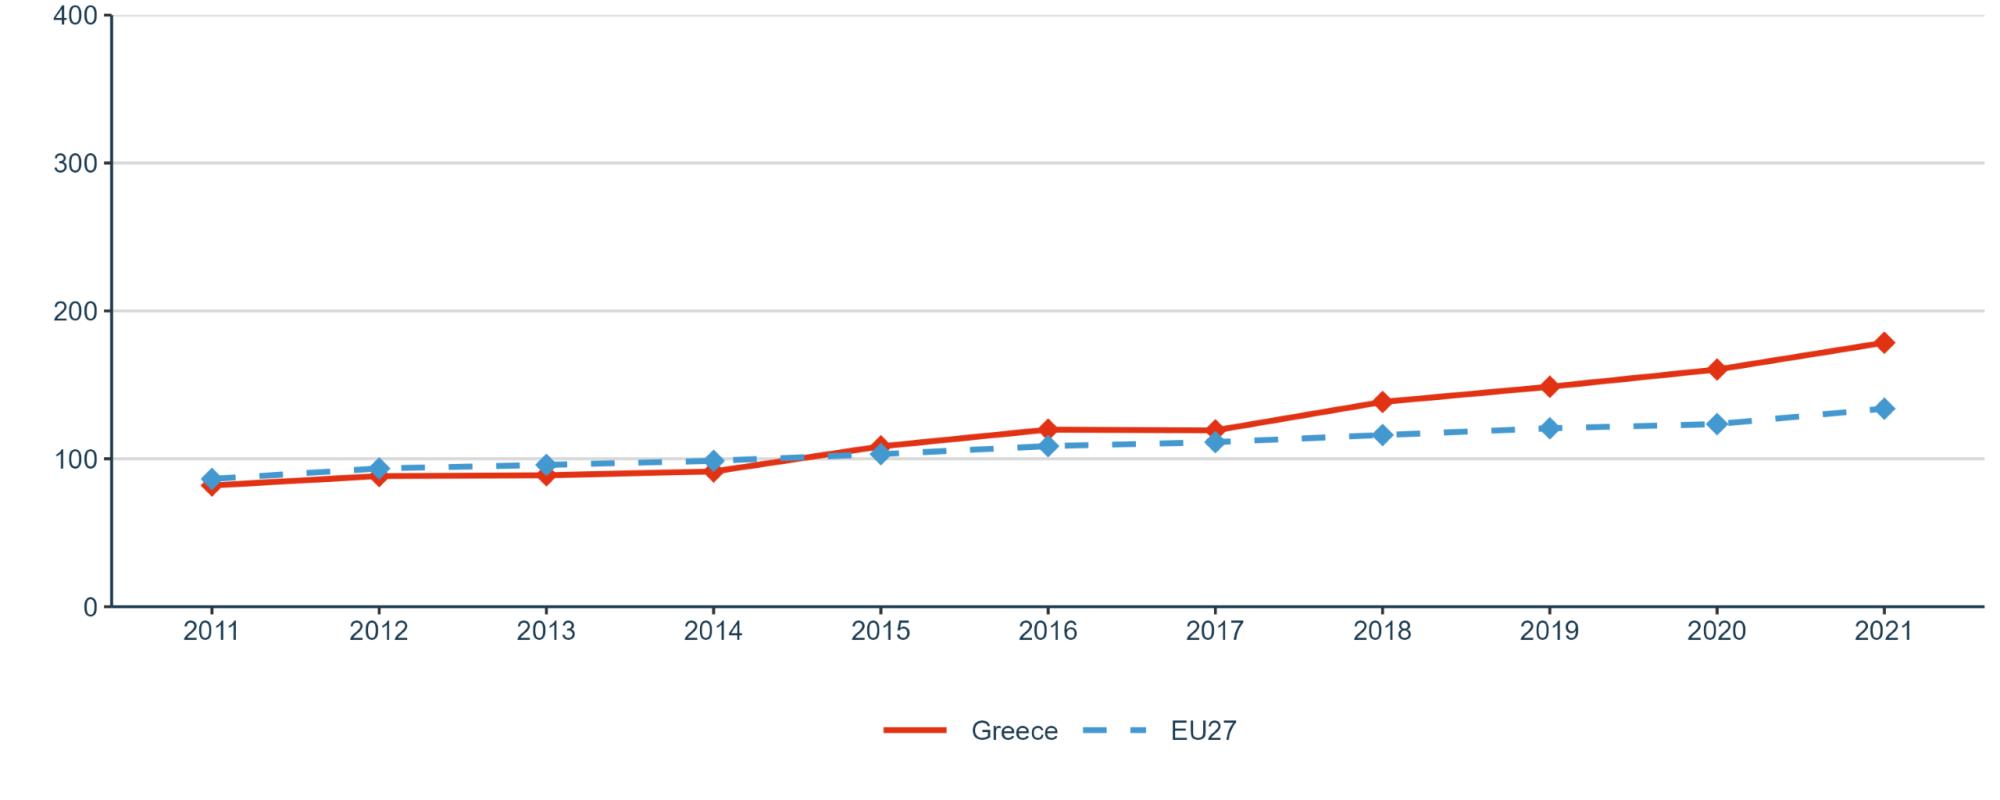
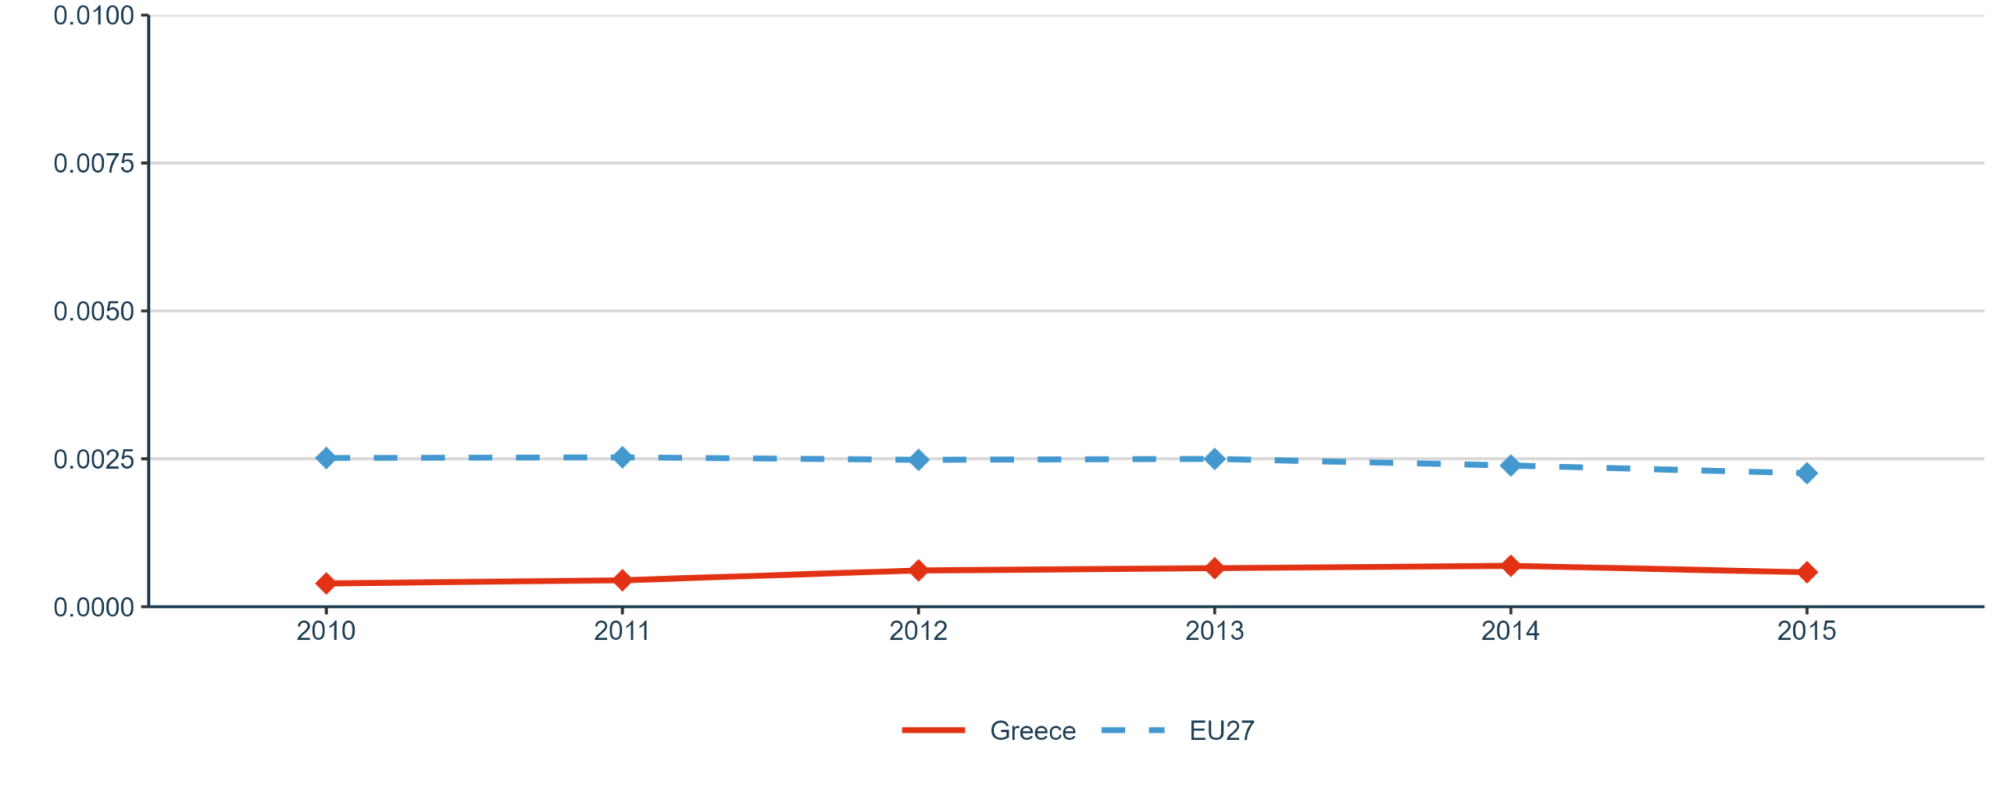
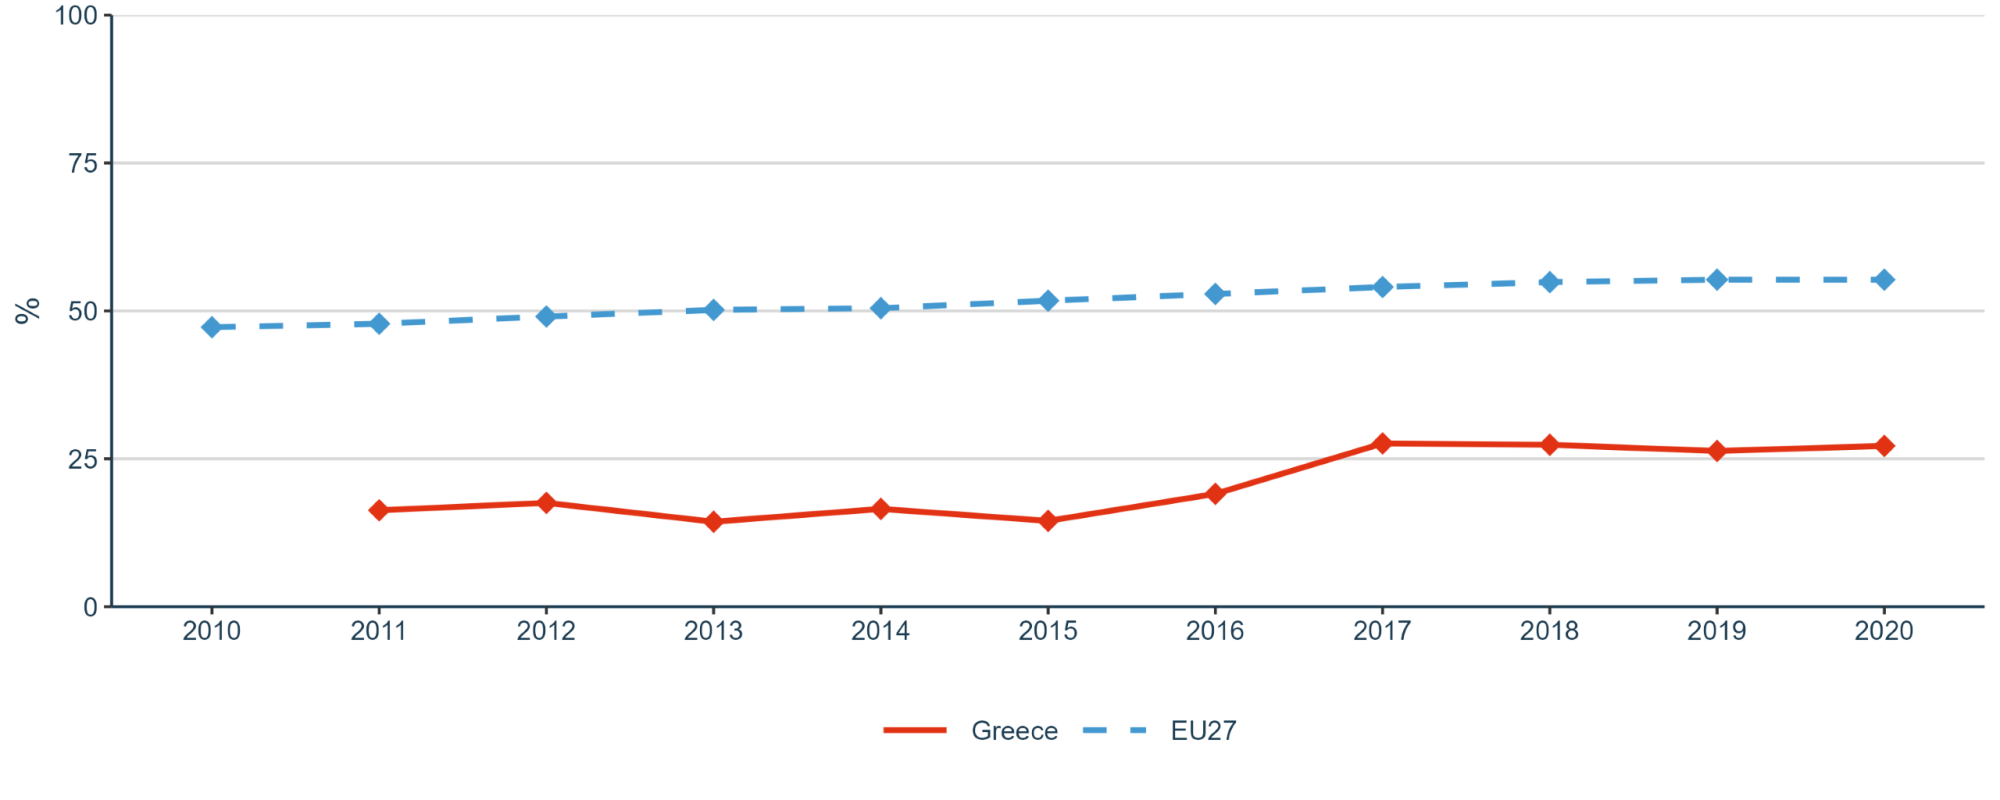
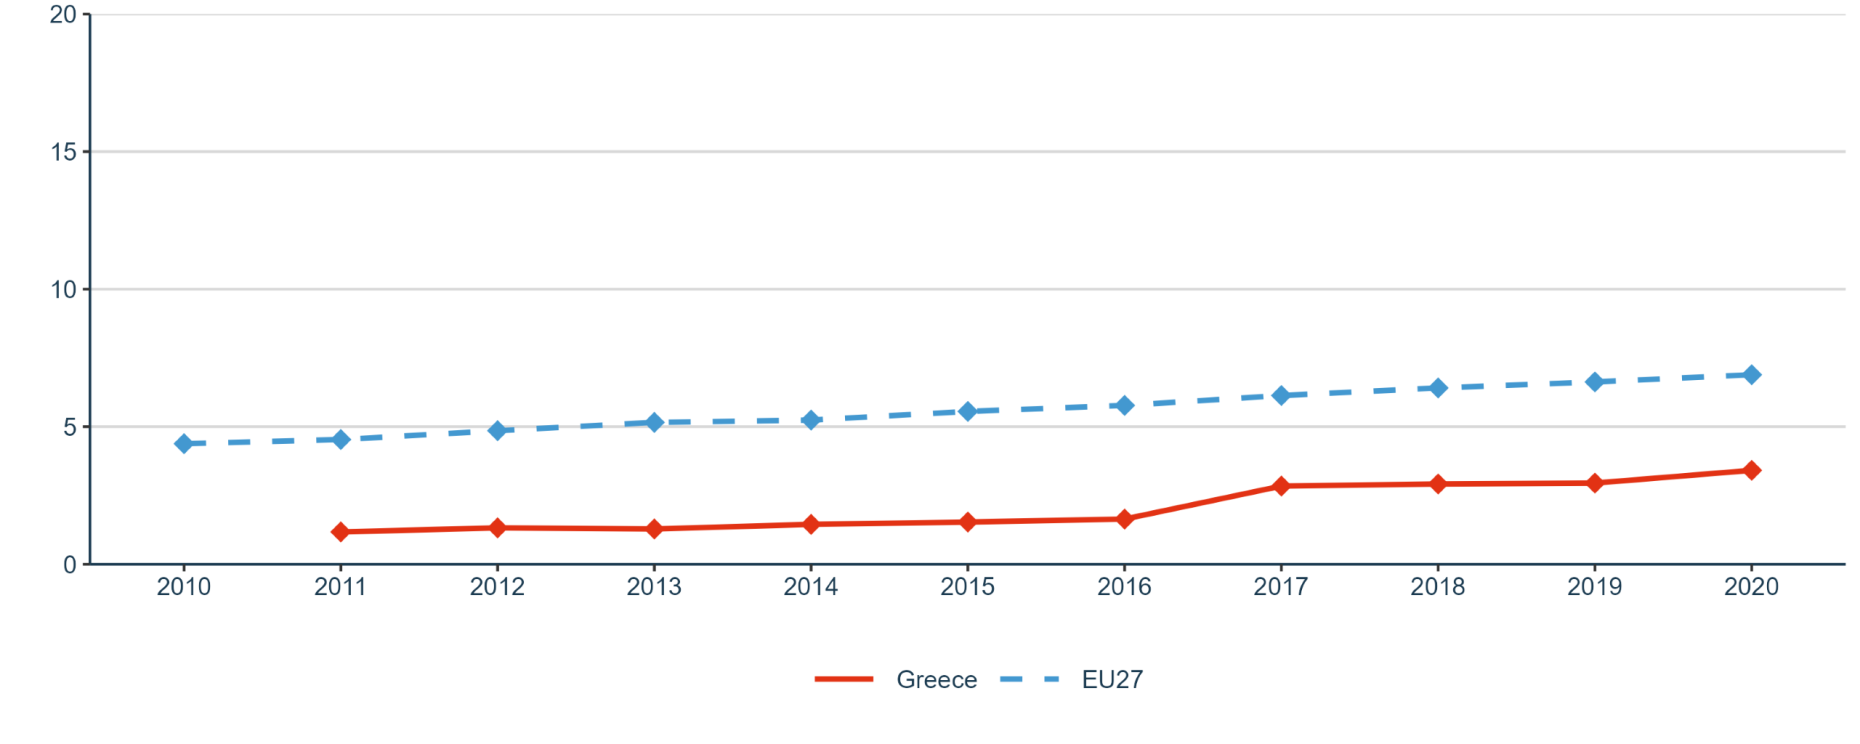
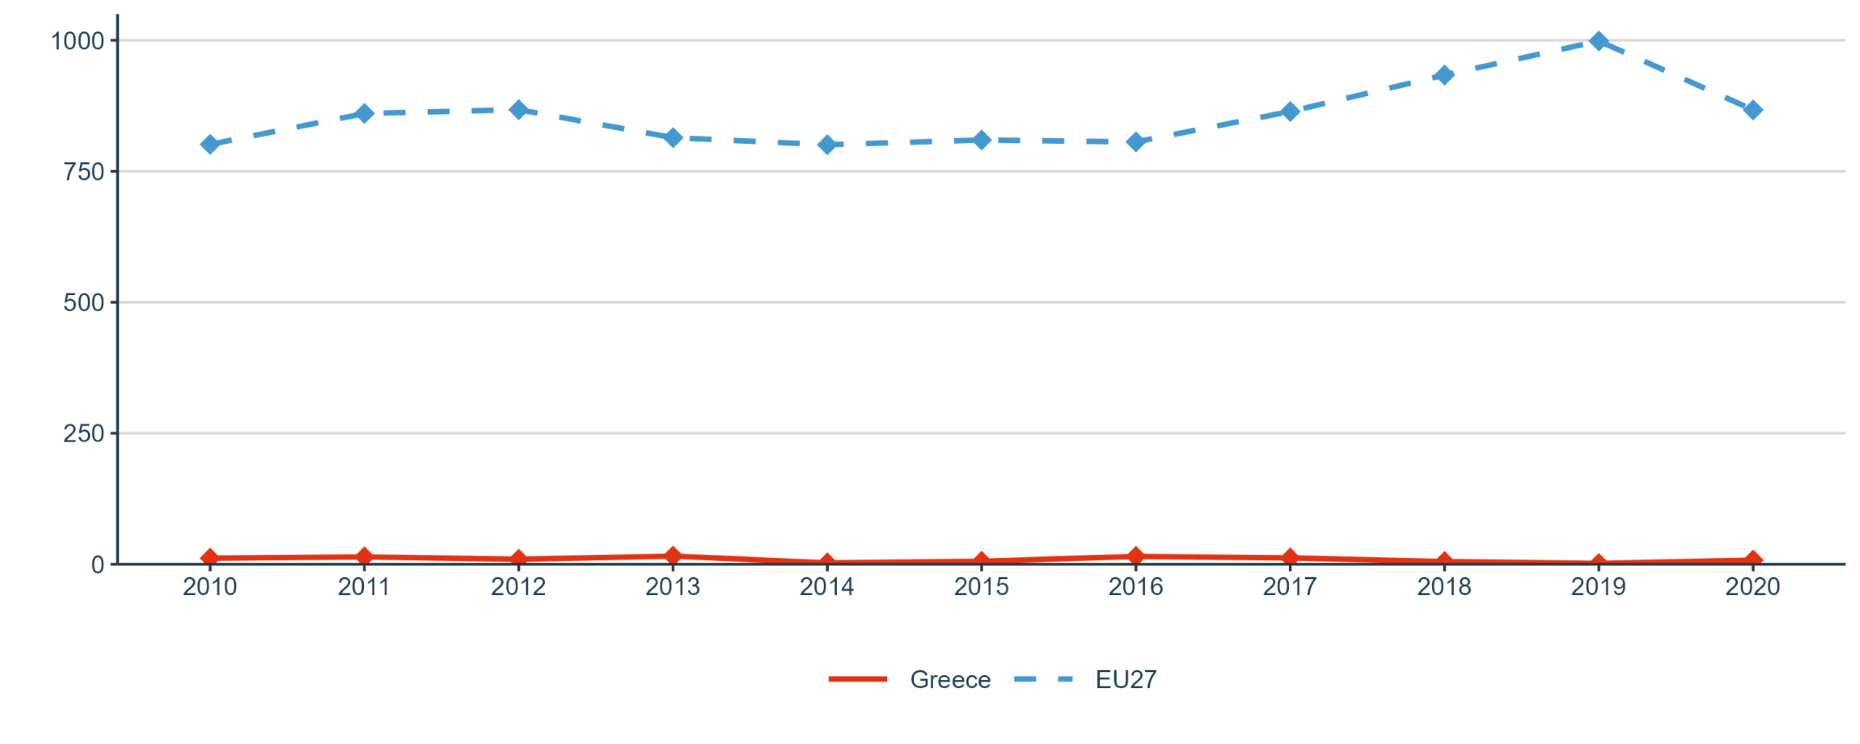
Sub-priority 1.5: Knowledge valorisation is addressed by the share of public-private co-publications (Figure 15 in Annex 1). Such value is similar for Greece and the EU in 2011, nonetheless, for the end of the period 2021 the Greek value shows a big increase and reaches around 190 per 1 million inhabitants. On the contrary, the Greek value for the number of PCT patents applications divided by GDP, is around six times lower than the average of the EU-27 (Figure 16 in Annex 1). The business enterprise researchers as percentage of the national total (Figure 17 in Annex 1) and the business enterprise researches in FTE per thousand employees in industry (Figure 18 in Annex 1) shows some fluctuations in Greece until reaching a peak in 2017 and remaining stagnated since then, but always under the EU-27.
Figure 19 in Annex 1 represents the share of innovating firms collaborating with higher education institutions or public/private research institutions in which some fluctuations can be observed in the trends between 2012 and 2018, after which the figure for both Greece and the EU as a whole starts to decrease.
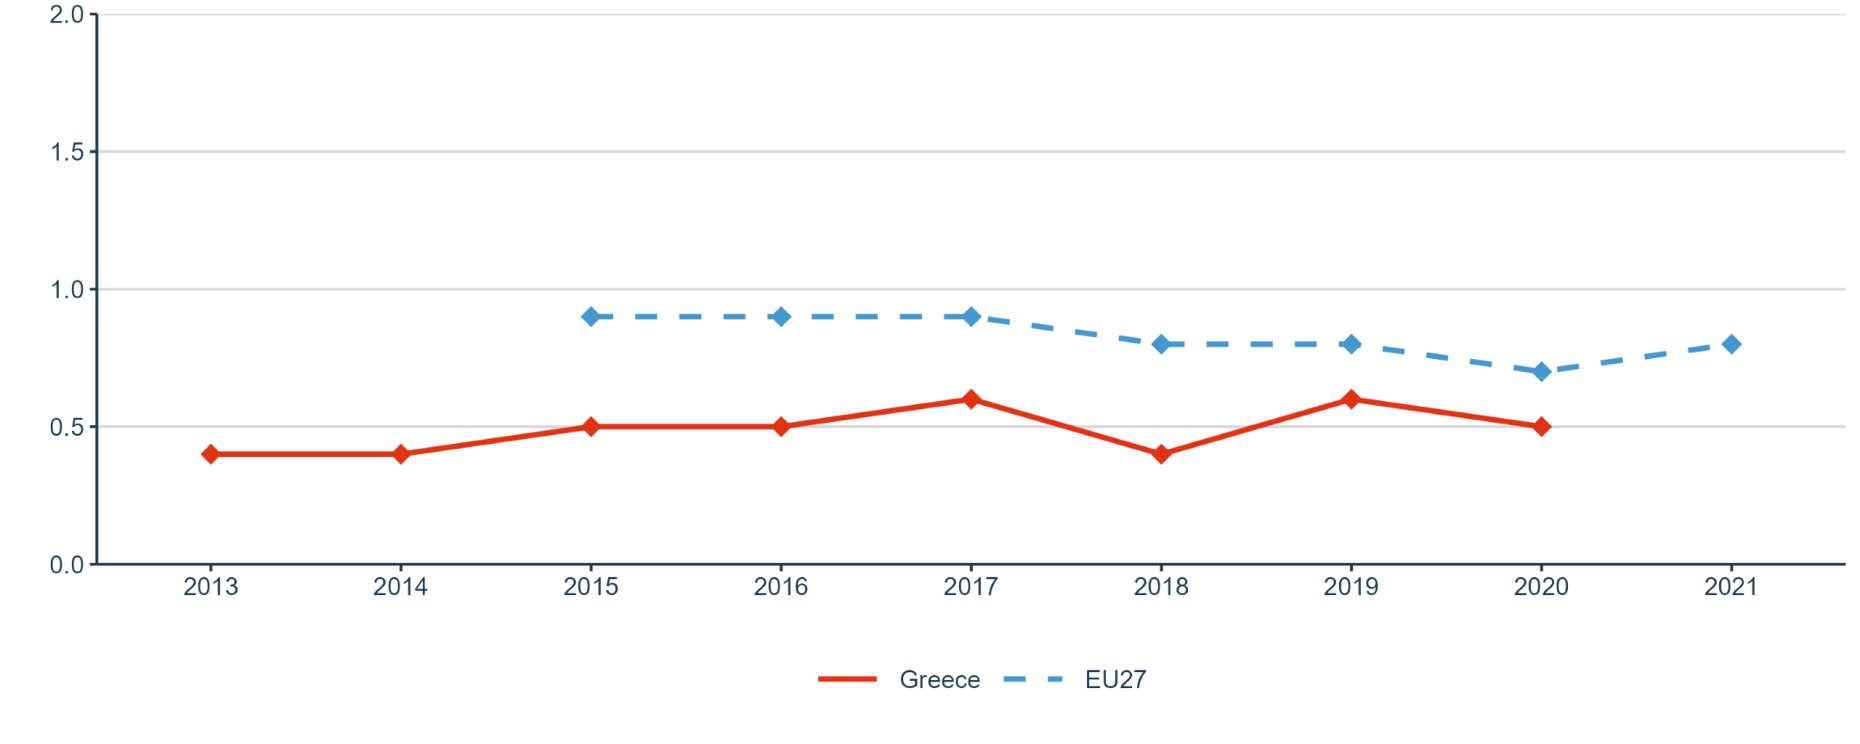
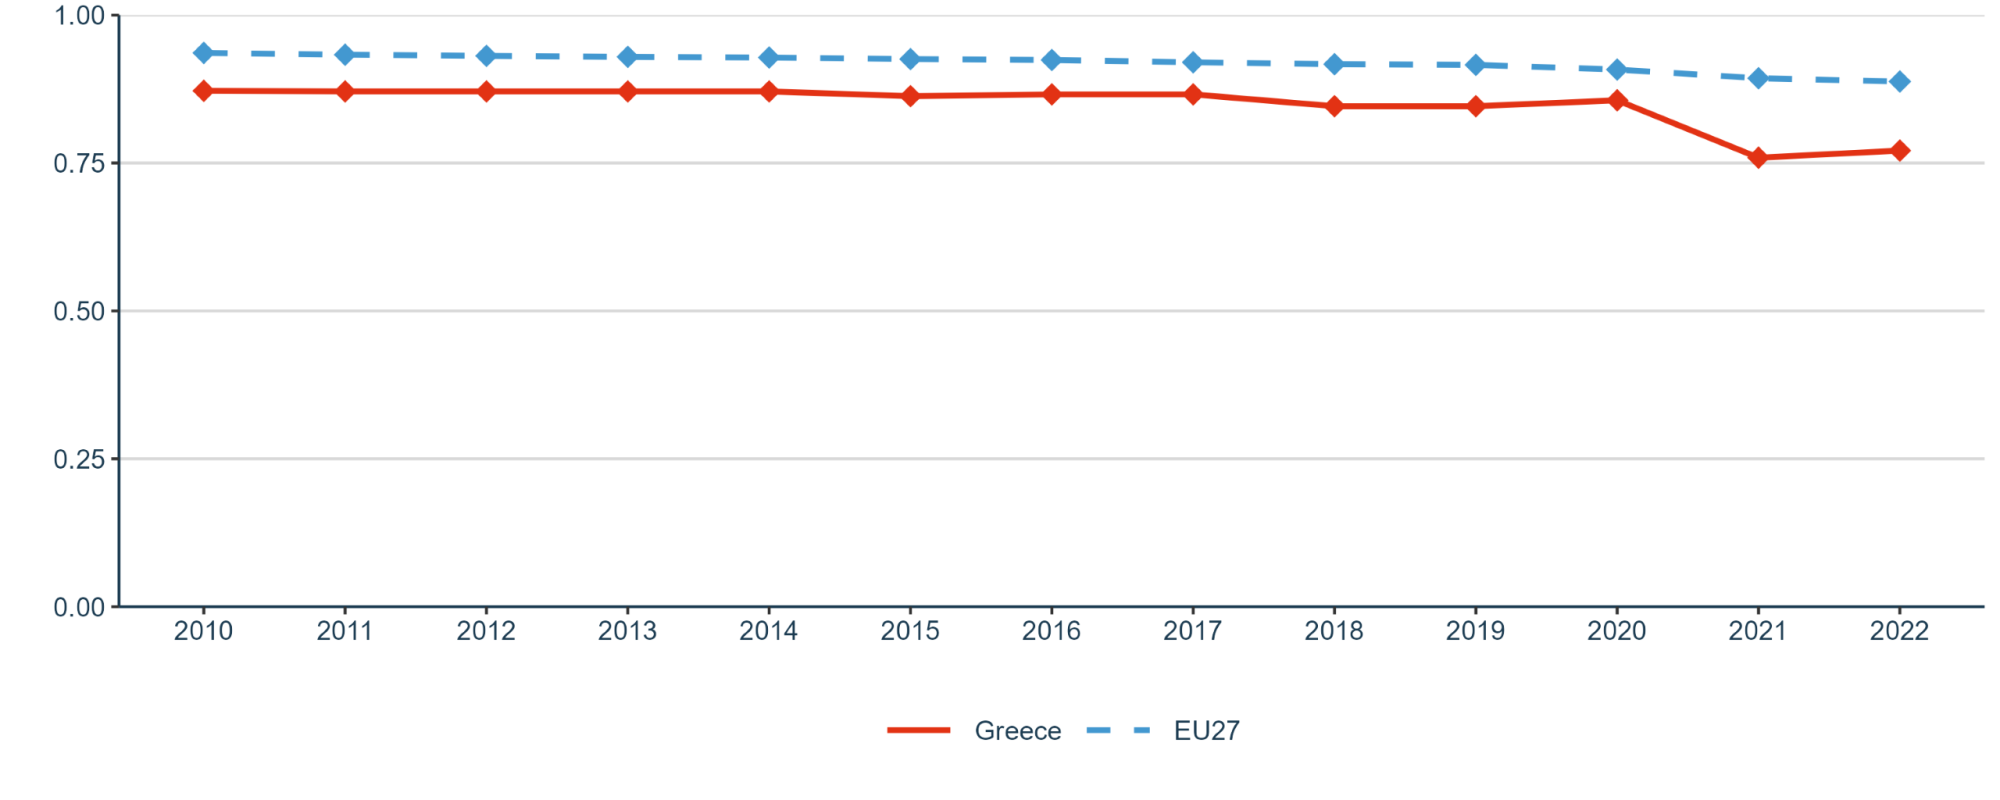
Supporting Sub-priority 1.6: Scientific Leadership, the number of scientific publications among the top-10% most cited publications worldwide as a percentage of all publications (Figure 20 in Annex 1) remain quite stagnant for Greece and below the EU-average. Similarly, the Academic Freedom Index (Afi) (Figure 21 in Annex 1) shows that Greece was slightly lower than the EU until dropping in 2021 to a score of around 0.75 (with a score of 1 being the highest level of academic freedom).
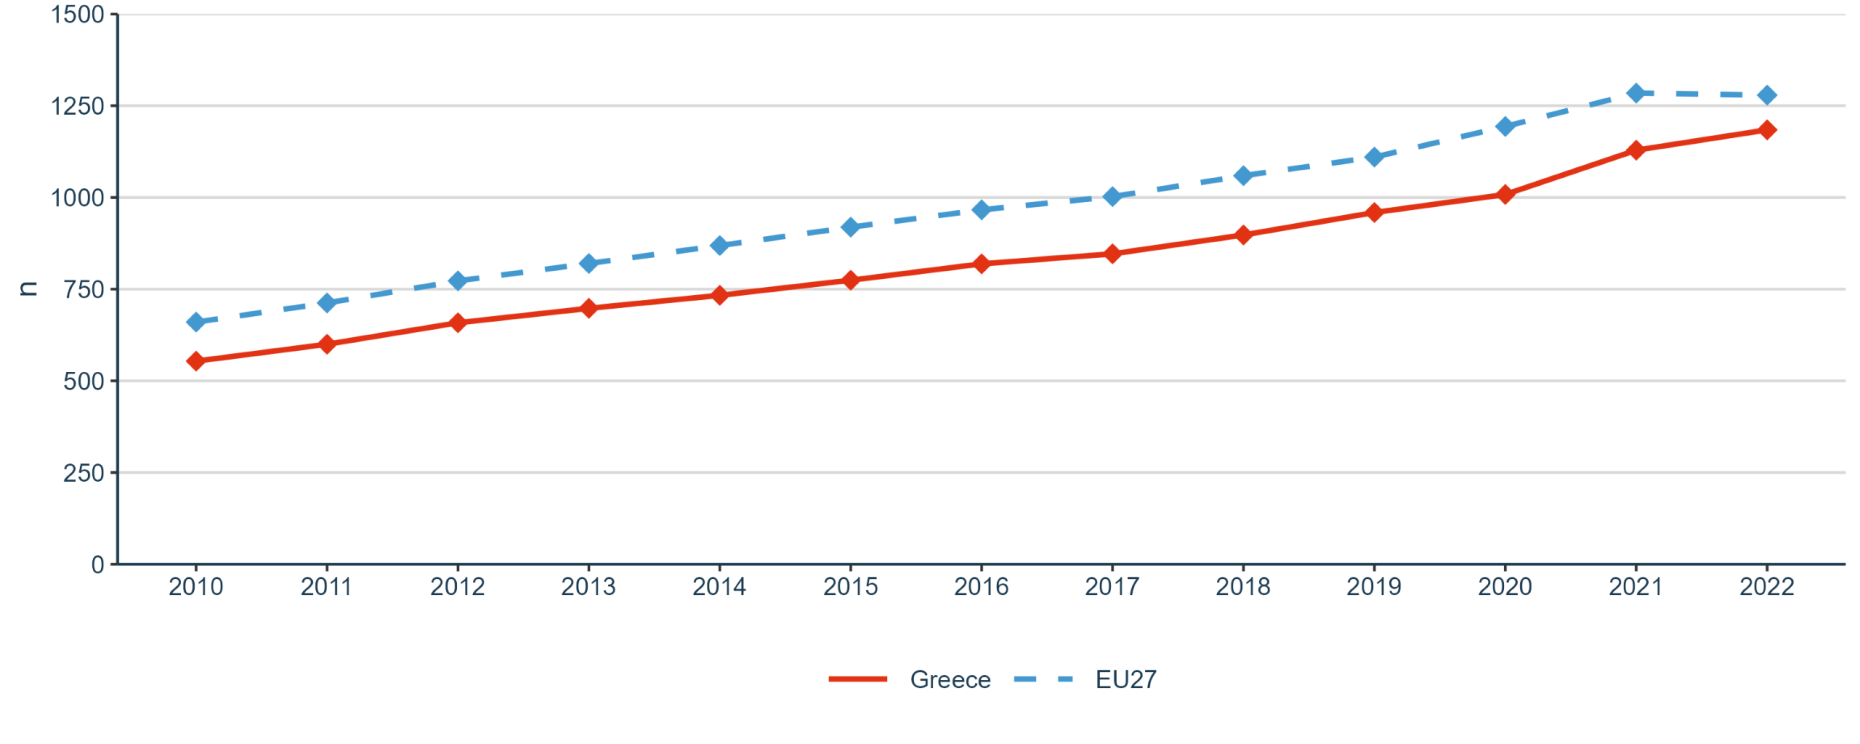
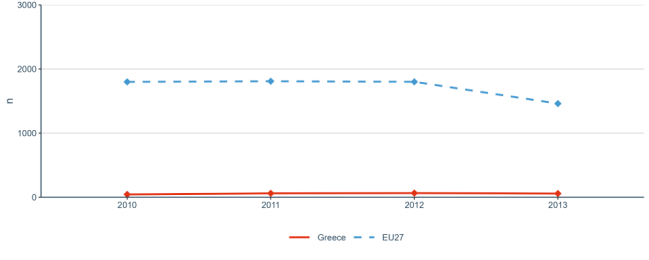
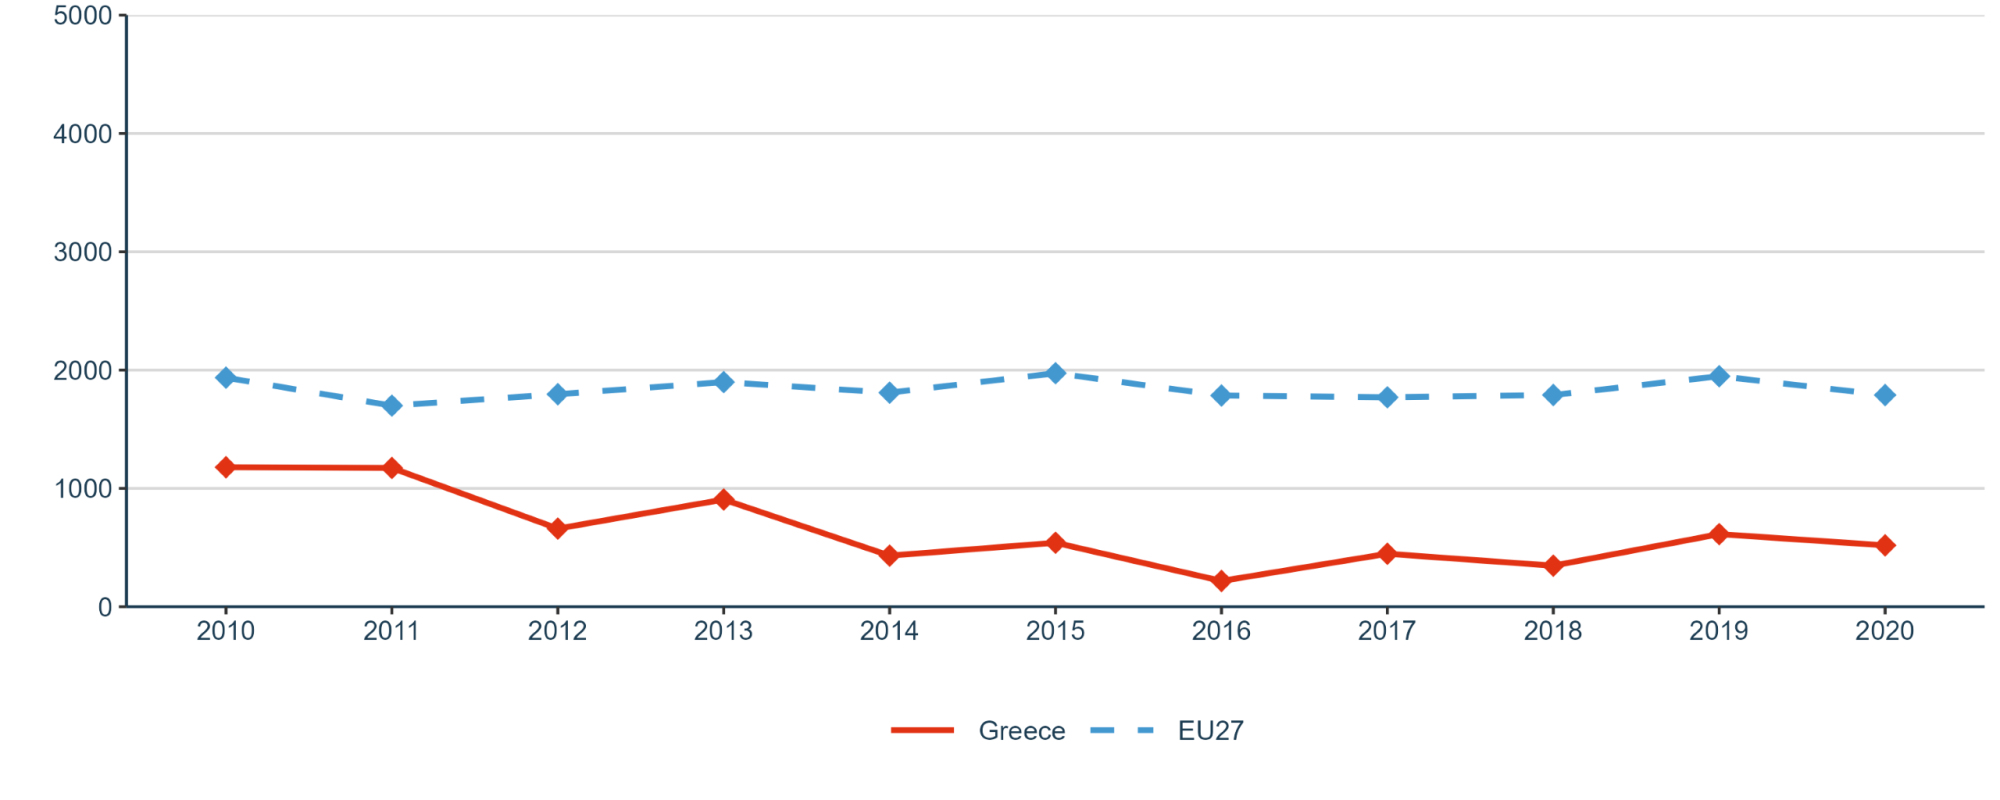
Sub-priority 1.7: Global engagement is assessed by the indicator European and international co-patenting in EPO applications at national and EU level (Figure 23 in Annex 1), in which Greece is consistently lower than the EU and remains around the same value for the whole period 2010-2013. On the other hand, Greece presents a better performance in the number of international co-publications with non-EU partners per 1,000 researchers in the public sector (Figure 22 in Annex 1). Although it remains slightly below the EU average, the country experiences a consistent increase from 2010 to 2022. In 2022, Greece´s data is around 1,008 while for the EU the value is 1,128.
2.2. ERA Priority 2: Taking up together the challenges posed by the twin green and digital transition and increasing society’s participation in the ERA
2.2.1. State of play in the implementation of the ERA Actions
In relation to ERA Action 10: Make EU R&I missions and partnerships key contributors to the ERA the Greek Recovery and Resilience Plan with a budget of EUR 31.164 billion includes, among others, actions that relate to the green and digital transition, addressing all SDGs. Greece is also supportive of creating synergies between the Horizon Europe and the structural funds as well as between European Missions and partnerships.
Regarding ERA Action 11: An ERA for green energy transformation, Greece is the one of only two EU countries that managed to not deviate from any of the 17 SDGs in 2021. The country is planning to mobilise a total investment of EUR 1.63 billion of the Just Transition Fund to alleviate the impact of the energy and climate transition on the local economy and society.
The last action to which Greece is committed under ERA Priority 2, is ERA Action 14: Bring Science closer to Citizens. Through initiatives such as the Thessaloniki International Fair or the Athens Science Festival, Greece aims to enhance the population´s interest on the areas of innovation and technology. Moreover, BEYOND Expo provides people an opportunity to get involved in the international environment of R&I and explore the effects of the 4th Industrial Revolution while getting in touch with digitalisation and sustainability.
2.2.2. Progress towards achieving ERA Priorities
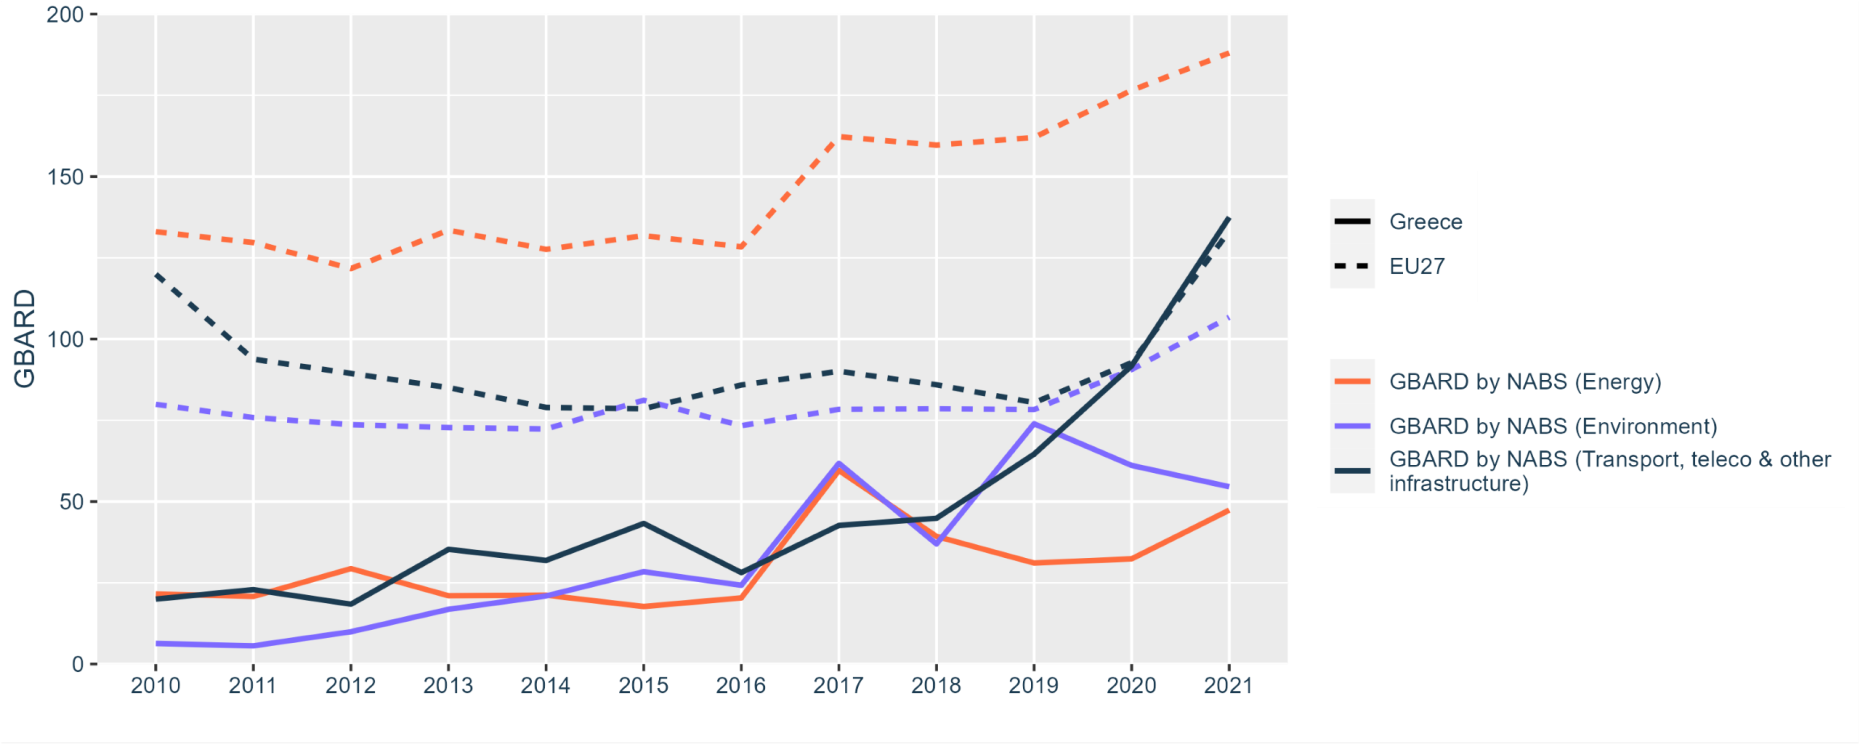
Progress towards achieving Sub-priority 2.1: Challenge-based ERA actions is measured through different indicators. First, the Government Budget Allocations for R&D (GBARD) by NABS in energy; environment; transport, and telecommunications and other infrastructure that refers to budget provisions rather than actual expenditures. Figure 24 of Annex 1 shows the average GBARD across EU-27 and Greece in million Euro. The GBARD for the three categories in Greece increases in the period, although the allocation for transport and telecommunications is the only one surpassing the EU-27 average.
The second indicator shows the GBARD allocated to European transnational, bilateral, or multilateral public R&D programmes per FTE researcher in the public sector (Figure 25 in Annex 1). The indicator is stagnant at the European level while at the national level it shows a decline after 2011 deteriorating the position of Greece related to EU-27 average significantly. Since 2016 there is a slight positive trend for Greece.
Environmentally related government R&D budget as a percentage of total government R&D budget shows significant variation over the years, but the performance of Greece is above the EU-27 (Figure 26 in Annex 1). Fluctuations are also present in OECD patents on environment technologies (Figure 28 in Annex 1), although in this case the trend is negative for Greece, aggravating its position after 2016 below the EU-27 average. In addition, Figure 27 in Annex 1 represents the national public and private investments as suggested in the SET Plan progress report 2021. While the EU experiences a positive evolution, Greece´s values reduce gradually (Figure 27 in Annex 1).
Sub-priority 2.2: Synergies with education and the European Skills Agenda is addressed by the share of researchers receiving transferable skills training (Figure 29 in Annex 1). The Greek value is higher than the EU-27, and the gap increases due to the positive evolution of the country and the decreasing trend of the EU-27 average.
With regard to progress towards achieving the Sub-priority 2.3: Synergies with sectorial policies and industrial policy, in order to boost innovation ecosystems, the indicator direct government support and Indirect government support through R&D tax incentives as a percentage of GDP (Figure 30 in Annex 1) shows a significant deviation of Greece from the EU average. The indicator both for Greece but also for the EU average has suffered overall stagnation over the 2010-2020 period, with a slight increase in Greece for 2020 with a value of 0.081%. However, it remains below the EU-27 average.
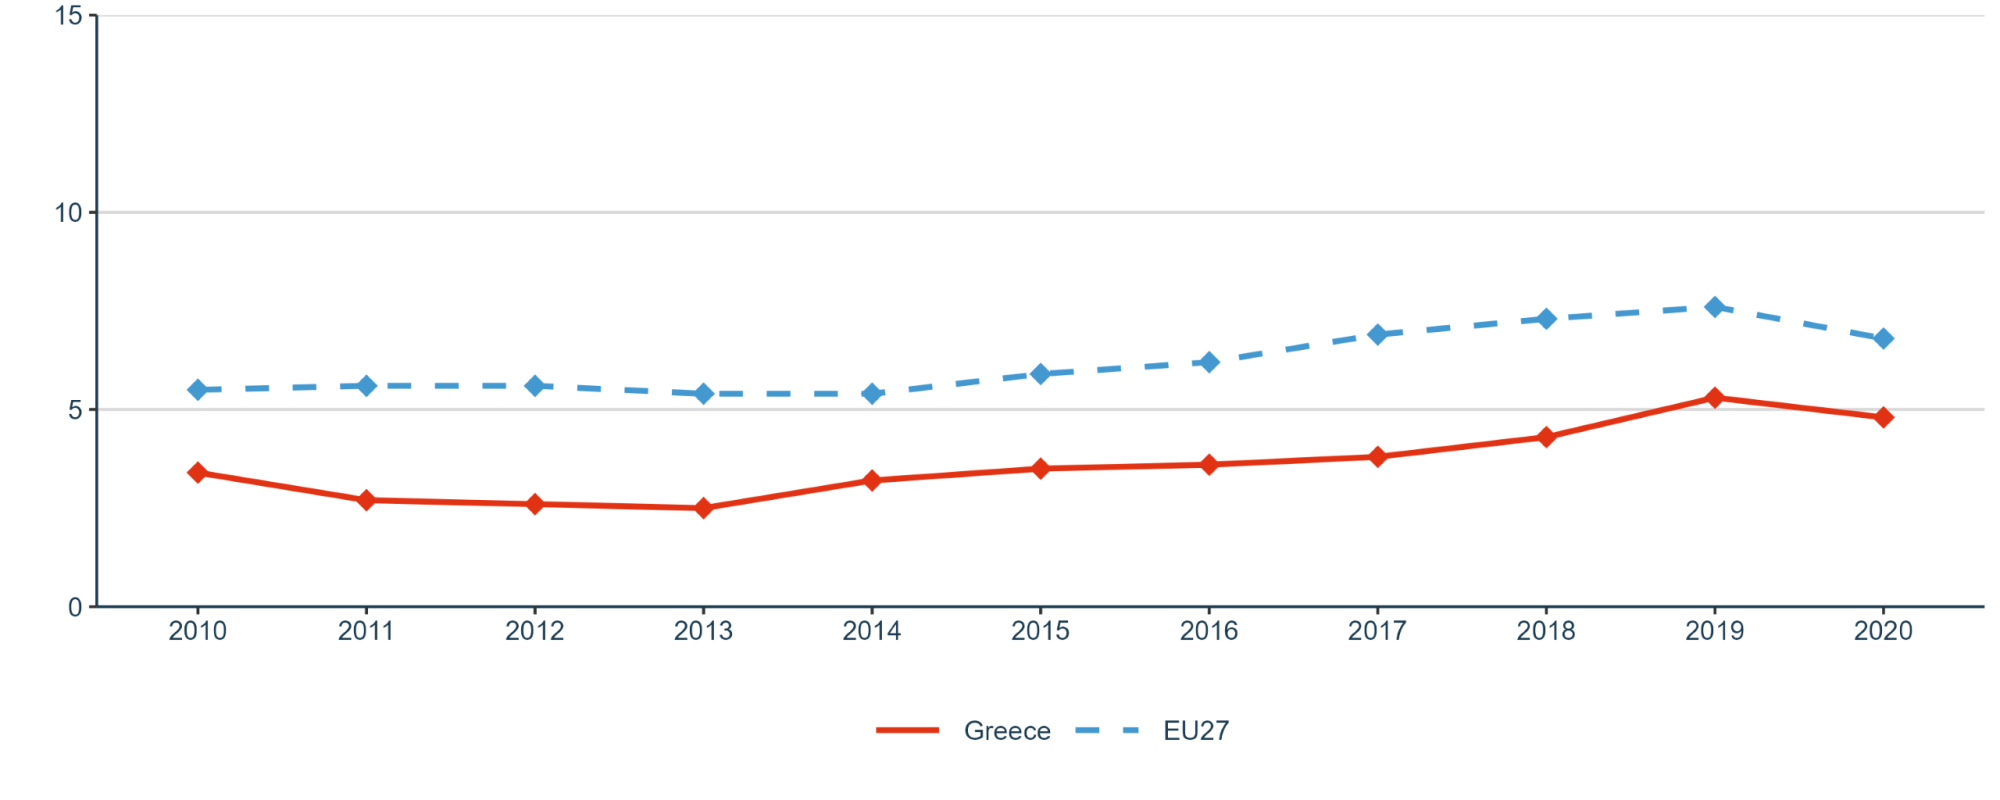
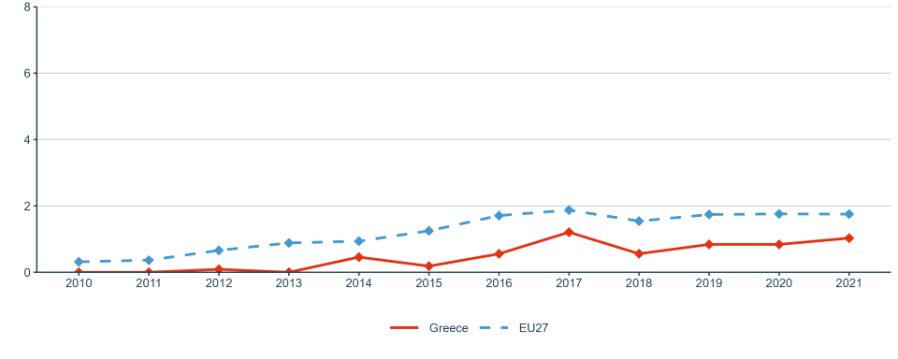
Achieving the Sub-priority 2.4: An active citizen and societal engagement in R&I in all its dimensions is assessed with two indicators (Figures 31 and 32 in Annex 1). The trust in science indicator shows a higher trust in Greece compared to EU-27. In relation to the number of publications on “social innovation” and “social entrepreneurship” per million population, Greece has followed the EU fluctuations although constantly below them. In 2021, the value for Greece stood in 1.03 compared to 1.75 at the EU level (Figure 32 in Annex 1).
2.3. ERA Priority 3: Amplifying access to research and innovation excellence across the Union
2.3.1. Progress towards achieving ERA Priorities
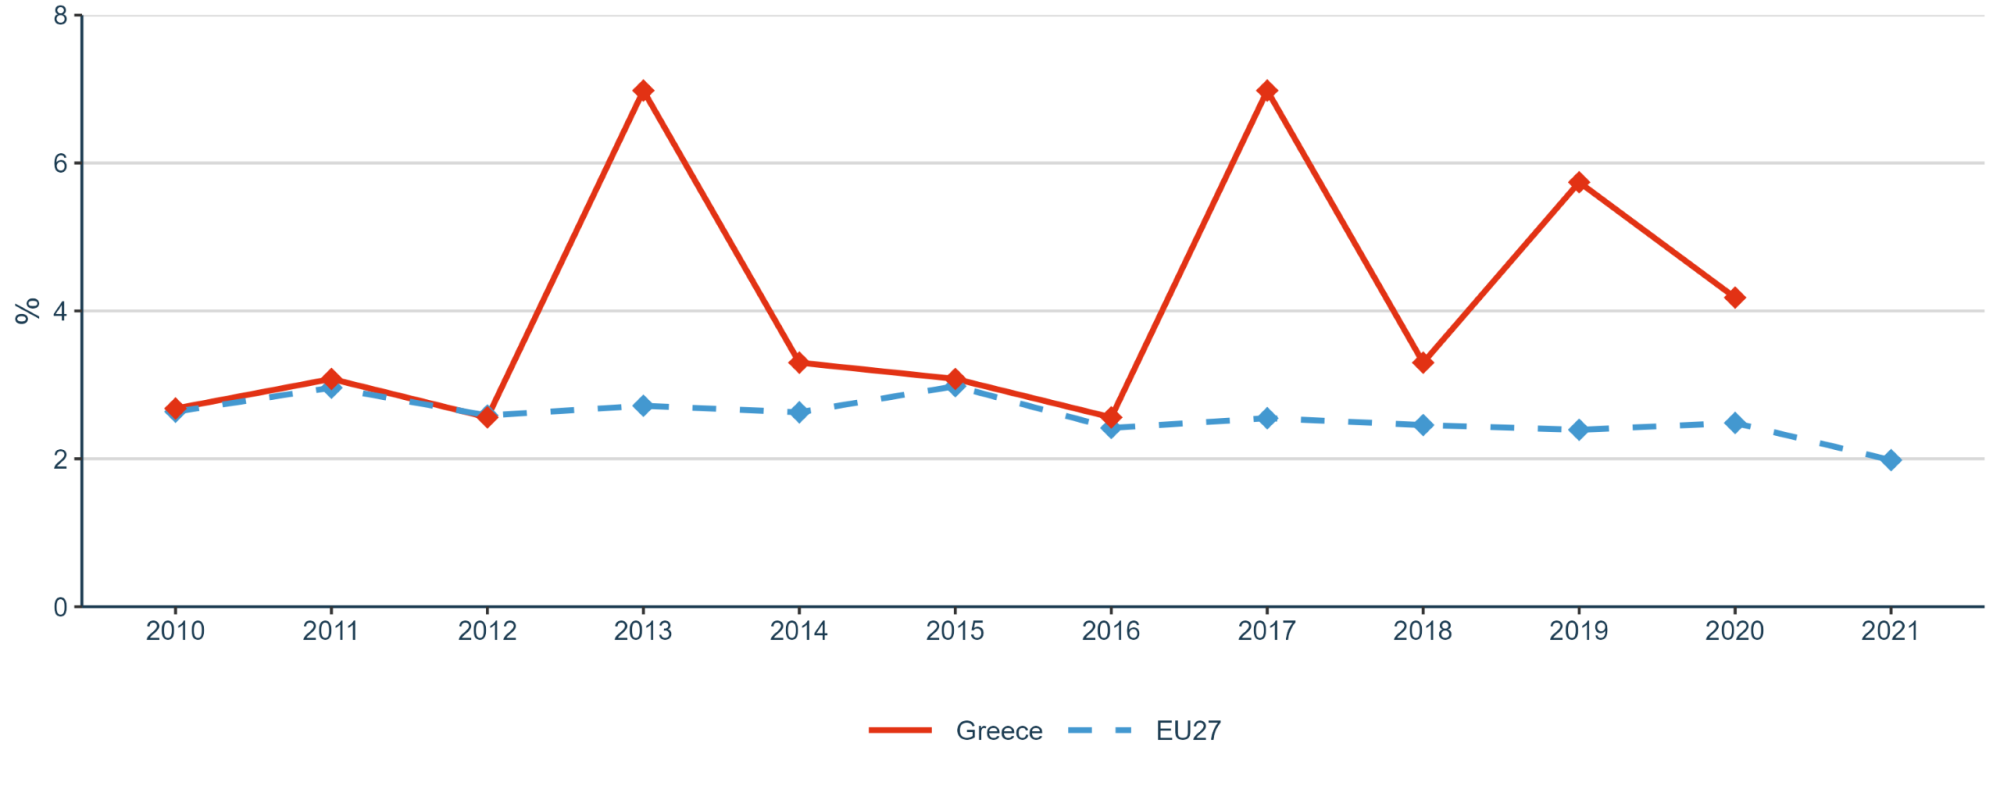
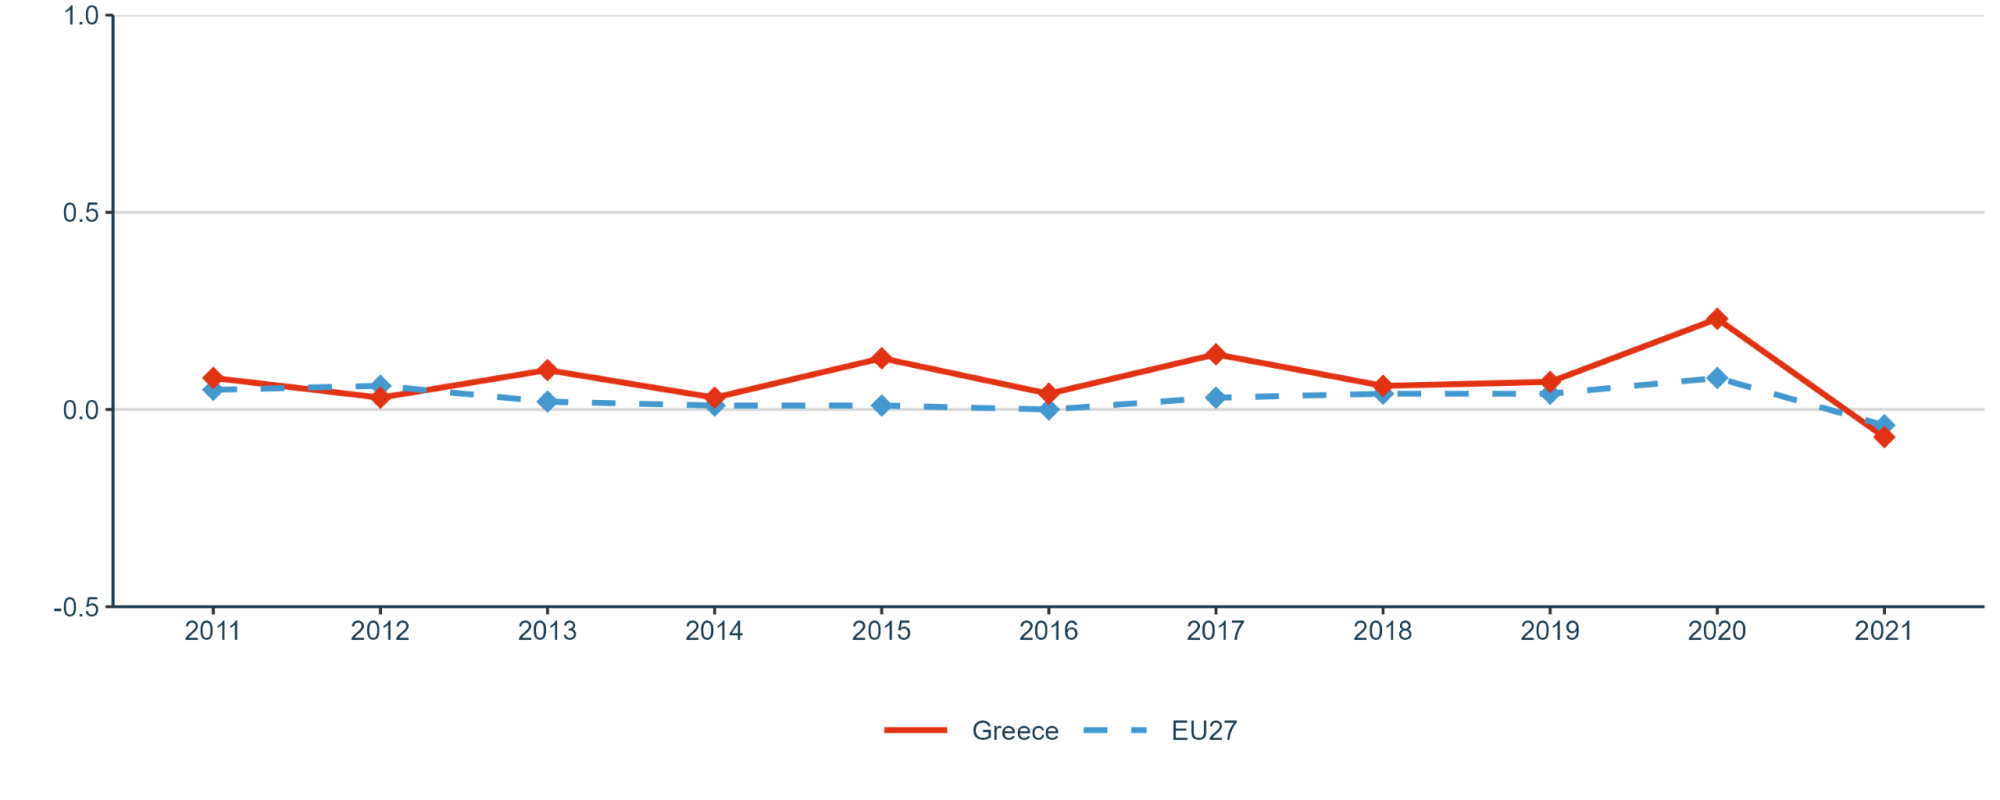
Regarding Sub-priority 3.1: More investments and reforms in countries and regions with lower R&I performance, the indicator measures the increase in total R&D expenditure expressed as a percentage of GDP. Greece presents constant fluctuation, in general over the EU-27 from 2011 to 2020. However, the country´s data falls slightly below the EU average in 2021 (Figure 33 in Annex 1).
2.4. ERA Priority 4: Advancing concerted research and innovation investments and reforms
2.4.1. Progress towards achieving ERA Priorities
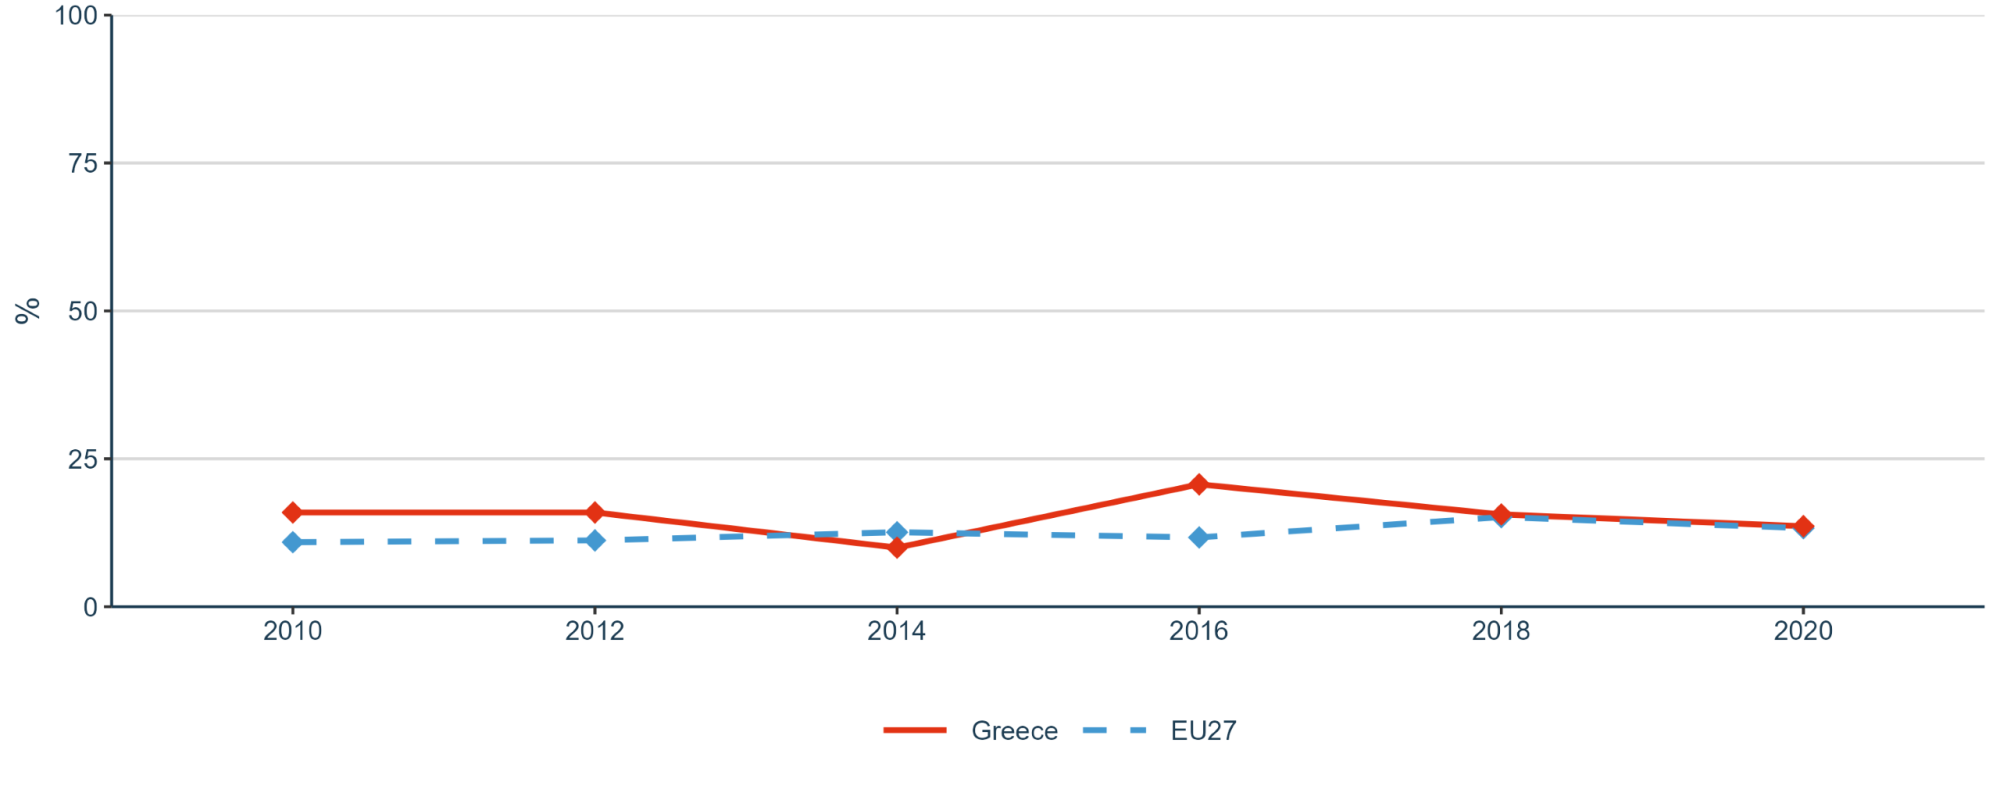
For Sub-priority 4.1: Coordination of R&I investments, the share of public R&D expenditures financed by the private sector (Figure 34 in Annex 1) presents similar trends for EU-27 and Greece from 2010 to 2020, with a slightly lower data for the Greece.
3. Country-specific drivers and barriers
Both the analysis of the key indicators and the qualitative assessment has enabled the identification of drivers and barriers for the country towards the achievement of the ERA priorities.
In relation to enabling factors and drivers, activities in Greece involving planning and decision-making on R&I policies are concentrated at the national level, offering greater cohesion and an opportunity for greater alignment of the policies towards the ERA. As an example, the investment in research infrastructures helped to streamline new investments, reinforced the credibility of regional research teams, and improved the overall researcher’s facilities, data platforms and software.
Among all ERA priorities, Greece is particularly committed to the development of research infrastructures with a dedicated strategy that builds on efforts from the previous programming period. The new National Roadmap for Research Infrastructures 2021-2027 incorporates some measures aiming at fostering long term sustainability, improving performance and impact, improving the cooperation between public research bodies and the private sector to effectively support knowledge and technology transfer. Such improvements will further contribute to the ERA Action 8 ‘Strengthen sustainability, accessibility and resilience of research infrastructures in the ERA’, as well as ERA Action 1 ‘Open sharing of knowledge and re-use of research outputs through the development of the European Open Science Cloud’. ^
Greece has also a significant participation in European research programmes such as the Horizon Europe. The collaboration between Greek researchers, research institutions and companies can facilitate the exchange of know-how, strengthening the interconnection of innovation ecosystems but also circulating good practices on policies and initiatives that lead to the priorities of the ERA.
Greece struggles with attracting and retaining researchers and talent in general. This is a barrier not only for developing the national research and innovation system but impacts also on Greece’s competitiveness vis-à-vis its global competitors. For this reason, the Greece’s Recovery and Resilience Plan includes measures for upskilling, labour market activation and reversing ‘brain drain’.
Finally, there are legal barriers that either hinder the implementation of specific policies and initiatives (e.g. RESAVER) or restrict the economic sustainability of specific investments (e.g. of research infrastructures).
4. Final remarks
Greece shows very steady engagement with the ERA Policy Agenda, focussing on the ERA priorities “Deepening a truly functioning internal market for knowledge” and “Taking up together the challenges posed by the Twin Green and Digital Transition and increasing society’s participation in the ERA”.
Besides these, Greece also prioritises the promotion of international cooperation and of gender equality, although it has not committed to these ERA Actions during the period 2022-2024. In terms of achieving the ERA priorities, Greece has demonstrated a relatively lower performance compared to the European average, although more progress can be expected based on the National Strategy for Research, Technological Development, and Innovation (NSRTDI – ESETAK) and the new National Strategy for Research Infrastructures.
5. Bibliography
Athanasiou, S., Amiridis, V., Gavriilidou, M., Gerasopoulos, E., Dimopoulos, A., Kaklamani, G., Karagiannis, F., Klampanos, I., Kondyli, D., Koumantaros, K., Konstantopoulos, P., Lenaki, K., Lykiardopoulos, A., Manola, N., Mitropoulou, D., Benardou, A., Boukos, N., Nousias, A., Ntaountaki, M., … Psomopoulos, F. (2021). National Plan for Open Science. Available at: https://zenodo.org/record/4656150#.YGXCvq8zY2w
Euraxes website https://www.euraxess.gr/
European Commission (2022). 2022 Country Report – Greece. Accompanying the document Recommendation for a Council Recommendation on the 2022 National Reform Programme of Greece and delivering a Council opinion on the 2022 Stability Programme of GreeceAvailable at: https://commission.europa.eu/system/files/2022-05/2022-european-semester-country-report-greece_en.pdf
European Commission, Directorate-General for Research and Innovation, (2022a). Country support for policies developing research infrastructures and the R&I ecosystem – Greece, Publications Office of the European Union, 2022, https://data.europa.eu/doi/10.2777/853856
European Commission Directorate-General for Research and Innovation, (2022b). Support to Greece for policies developing research infrastructures and the R&I ecosystem https://gsri.gov.gr/wp-content/uploads/2022/10/Support-to-Greece-for-policies-developing-research-infrastructures-and-the-RI-ecosystem.pdf
European Commission, Directorate-General for Research and Innovation (2022c). PSF provides recommendations to make Greece’s research infrastructures more sustainable, Publications Office of the European Union, 2022, https://data.europa.eu/doi/10.2777/971528
European Commission (2023). 2023 Country Report – Greece. Accompanying the document Recommendation for a Council Recommendation on the 2023 National Reform Programme of Greece and delivering a Council opinion on the 2023 Stability Programme of Greece, Brussels 24.5.2023, 608 final. Available at: https://economy-finance.ec.europa.eu/system/files/2023-05/EL_SWD_2023_608_en.pdf
European Commission, Directorate-General for Research and Innovation, Hollanders, H. (2023). European Innovation Scoreboard 2023 Country profile Greece. Available at: https://ec.europa.eu/assets/rtd/eis/2023/ec_rtd_eis-country-profile-el.pdf
European Commission (2023c) Support to Greece in the implementation of PSF Country recommendations, Final Report. Available at: https://gsri.gov.gr/wp-content/uploads/2023/10/230831-Final-Report_PSF-Open-Greece_FINAL-VERSION.pdf
European Open Science Cloud website https://eosc-portal.eu/greece
General Secretariat for Research and Innovation (GSRI) website https://gsri.gov.gr/en/
General Secretariat for Research and Technology GSRT and Ministry of Education and Religious Affairs (2014) National Roadmap for Research Infrastructures http://www.gsrt.gr/News/Files/New987/road-map-web_version_final.pdf
Greece’s Recovery and Resilience Plan (RRP) website https://greece20.gov.gr/
Gypakis, A. (2023). Application of Smart Specialisation Strategy for Research and Innovation. Programming Period 2021-2027, Commercial and Industrial Chamber, Irakleio, 6 April 2023, https://ibo.crete.gov.gr/wp-content/uploads/2023/04/gypakis.pdf
Hellenic Academic Libraries Link (HEAL-Link) website https://www.heal-link.gr/en/home-2/
Hellenic Academic Management Initiative (HARDMIN) website https://hardmin.heal-link.gr/
Hellenic Data Service (HELIX) website https://hellenicdataservice.gr/main/
Hellenic Foundation for Research and Innovation (HFRI) website https://www.elidek.gr/en/homepage/
Hellenic Republic (2019) National Energy and Climate Plan, Ministry of the Environment, Athens https://energy.ec.europa.eu/system/files/2020-01/el_final_necp_main_el_0.pdf
Hellenic Republic (2021) Digital Transformation Bible 2020-2025 https://digitalstrategy.gov.gr/en/
Law 4310/2014 Research, Technological Development and Innovation and other provisions, (Government Gazette (GG) 258 A/2014). Available at: https://gsri.gov.gr/wp-content/uploads/2021/09/%CE%9D4310-2014.pdf
National Council for Research, Technology and Innovation (NCRTI) website https://esetek.gov.gr/en/home/
Thomas Neidenmark, Gareth O'Neill, & Istvan Karasz. (2023). EOSC Catalogue of Best Practices. Available at: https://doi.org/10.5281/zenodo.7574165
6. Annexes
6.1. Annex 1: Graphs
The 2023 ERA Scoreboard and ERA Dashboard indicators used in the country report are presented in this annex. Detailed information on the data sources, description of the indicators, time period for which the data is available, and the necessary calculations can be found in the ERA Scoreboard and ERA Dashboard Methodology Report. In addition, the research aimed to use the latest data available for each indicator, the most recent data for some of them dates from several years ago.
General Indicators

Priority 1: Deepening a truly functioning internal market for knowledge
Sub-priority 1.1: Open Science
Sub-priority 1.2: Research infrastructures
Sub-priority 1.3: Gender equality, equal opportunities for all and inclusiveness


Sub-priority 1.4: Researchers’ careers and mobility and research assessment and reward systems
Sub-priority 1.5: Knowledge valorisation
Sub-priority 1.6: Scientific leadership

Sub-priority 1.7: Global engagement
Priority 2: Taking up together the challenges posed by the twin green and digital transition, and increasing society’s participation in the ERA
Sub-priority 2.1: Challenge-based ERA actions

Sub-priority 2.2: Synergies with education and the European Skills Agenda
Sub-priority 2.3: Synergies with sectorial policies and industrial policy, in order to boost innovation ecosystems

Sub-priority 2.4: An active citizen and societal engagement in R&I in all its dimensions
Priority 3: Amplifying access to research and innovation excellence across the Union
Sub-priority 3.1: More investments and reforms in countries and regions with lower R&I performance
Priority 4: Advancing concerted research and innovation investments and reforms
Sub-priority 4.1: Coordination of R&I investments